Set Up Your First Feed
Step-by-step walkthrough of onboarding your first log source in nano using parser repositories or the log source wizard
Set Up Your First Feed
A feed (or log source) tells nano how to parse a specific type of log. Before nano can normalize and search your data, it needs a parser that maps raw log fields into the unified data model.
This guide walks through onboarding your first feed end-to-end — from gathering credentials to seeing parsed events in search.
Step 1: Gather Your Credentials
Before you can send logs to nano, you need two things from your deployment:
- Login credentials — your username and password for the nano web UI
- Vector ingestion token — the Bearer token used to authenticate log shippers sending data to nano
Both are available in your deployment dashboard at app.nano.rs. The ingestion token is shown in your deployment's settings under Ingestion Credentials.
Step 2: Check Your Source Configurations
nano ships with two ingestion sources enabled by default:
- HTTP Ingestion — accepts logs over HTTP on port 8080 (the most common method)
- Vector Native — accepts logs from on-premise Vector aggregators on port 6000
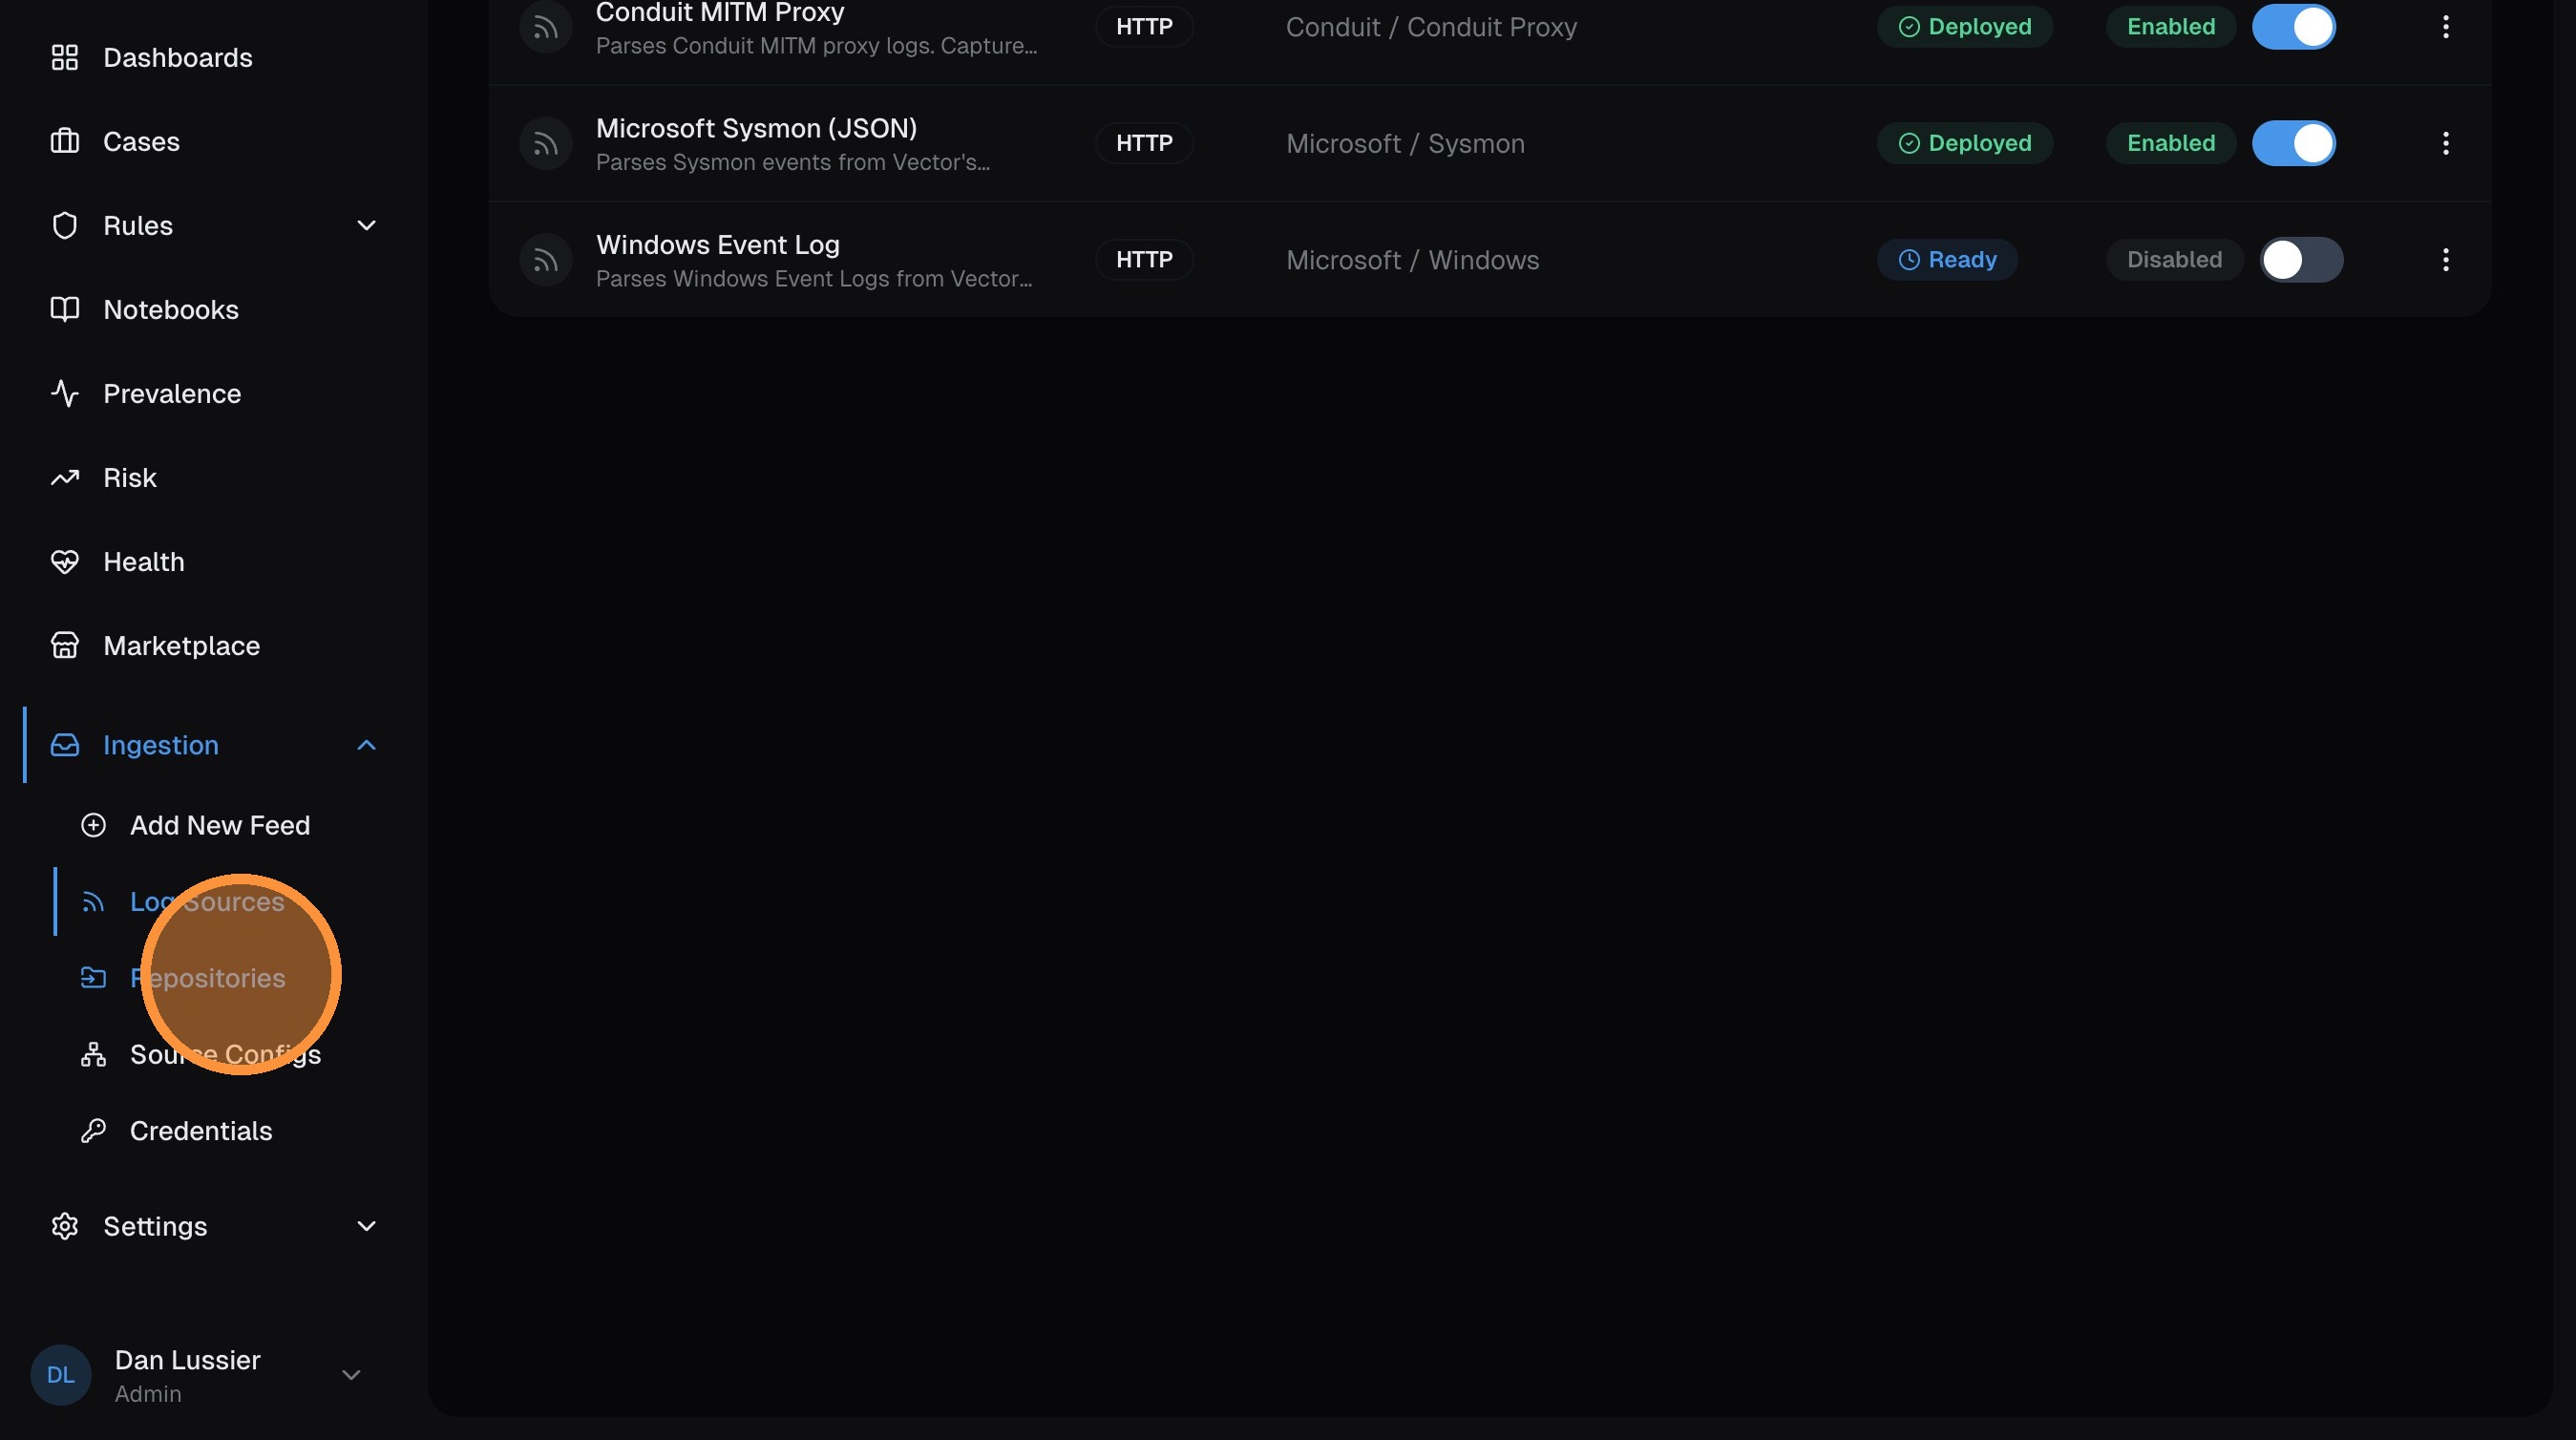
If you need additional sources (Kafka, AWS S3/SQS, GCP Pub/Sub, Splunk HEC), enable them first:
- Go to Ingestion > Source Configs in the left sidebar
- Enable and configure whichever additional sources you need
For most setups, the default HTTP source is all you need to get started.
Step 3: Navigate to Log Sources
Log in to nano and you'll land on the Getting Started page. This wizard tracks your setup progress — click Log Source to jump straight to creating your first feed.
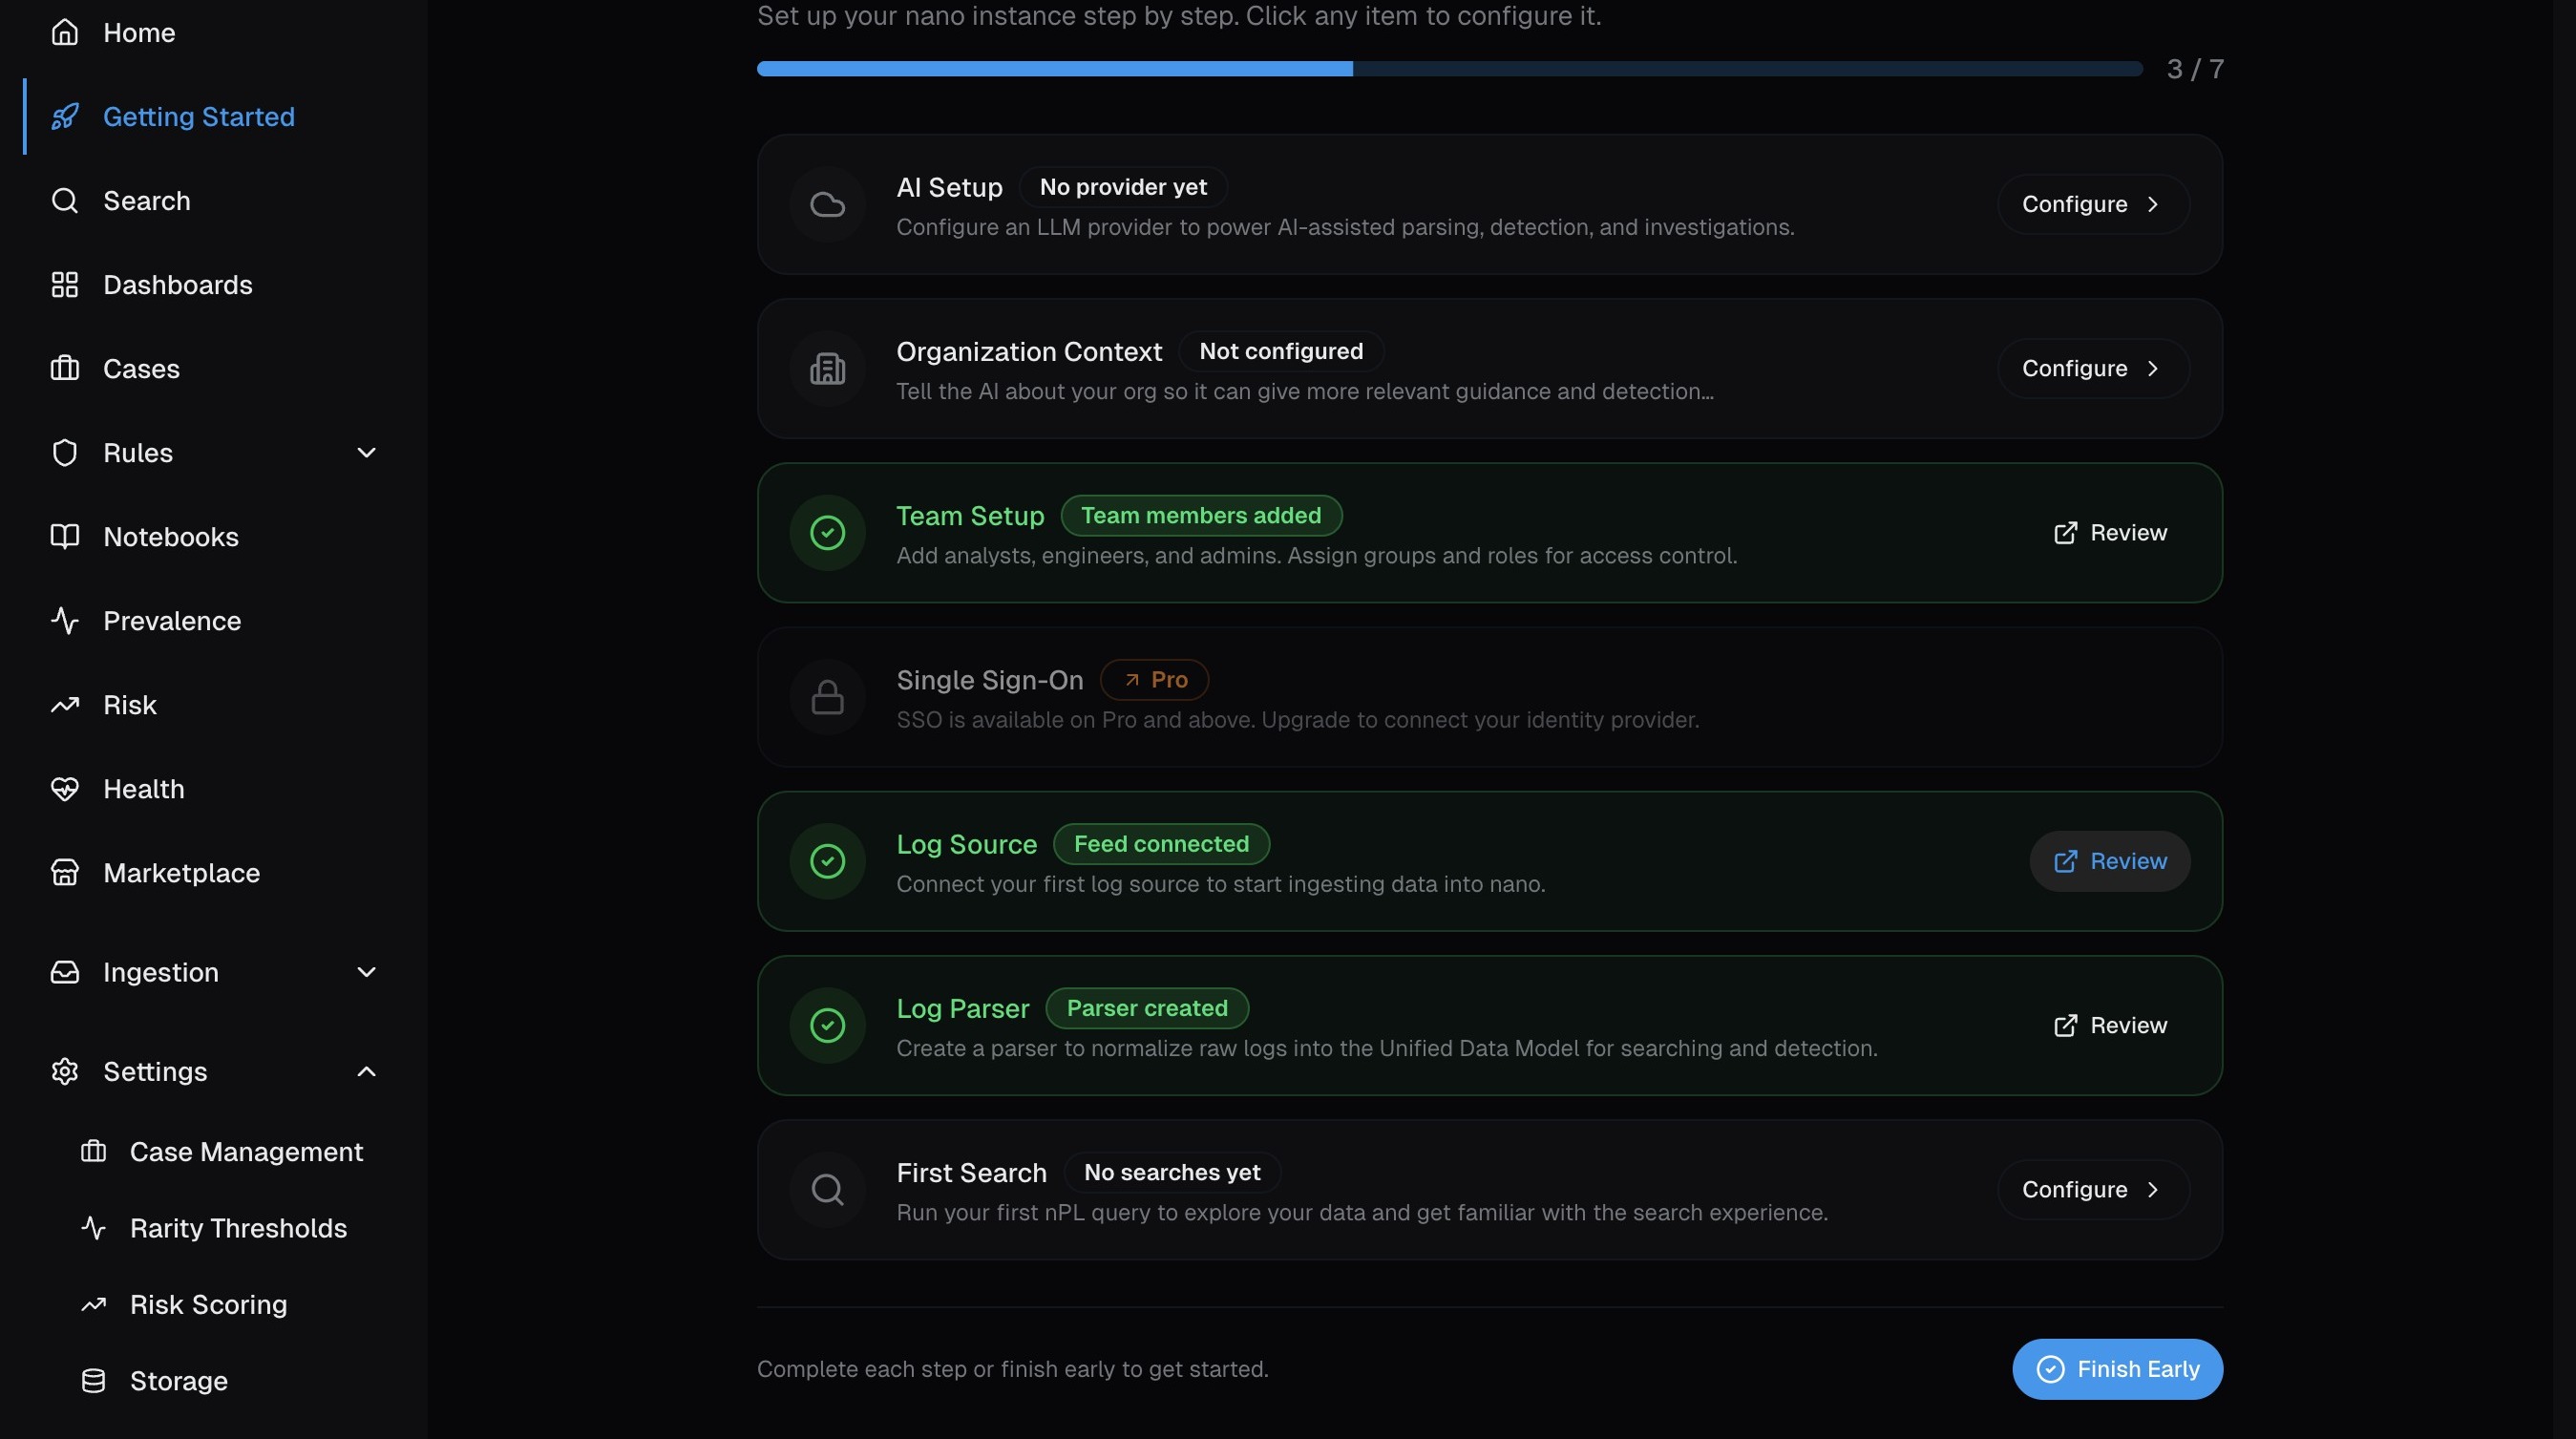
Alternatively, expand Ingestion in the left sidebar and click Log Sources to go directly to the feed management page.
Step 4: Import a Parser from Repositories
The fastest way to onboard a log source is to import a pre-built parser from the nano parser repository. nano ships with 57+ parsers covering common sources — AWS, Azure, GCP, Windows, Sysmon, Palo Alto, CrowdStrike, Okta, and many more.
Open the Repositories tab
From the Log Sources page, click the Repositories tab. You'll see a searchable list of all available parsers with their category, vendor, version, and import status.
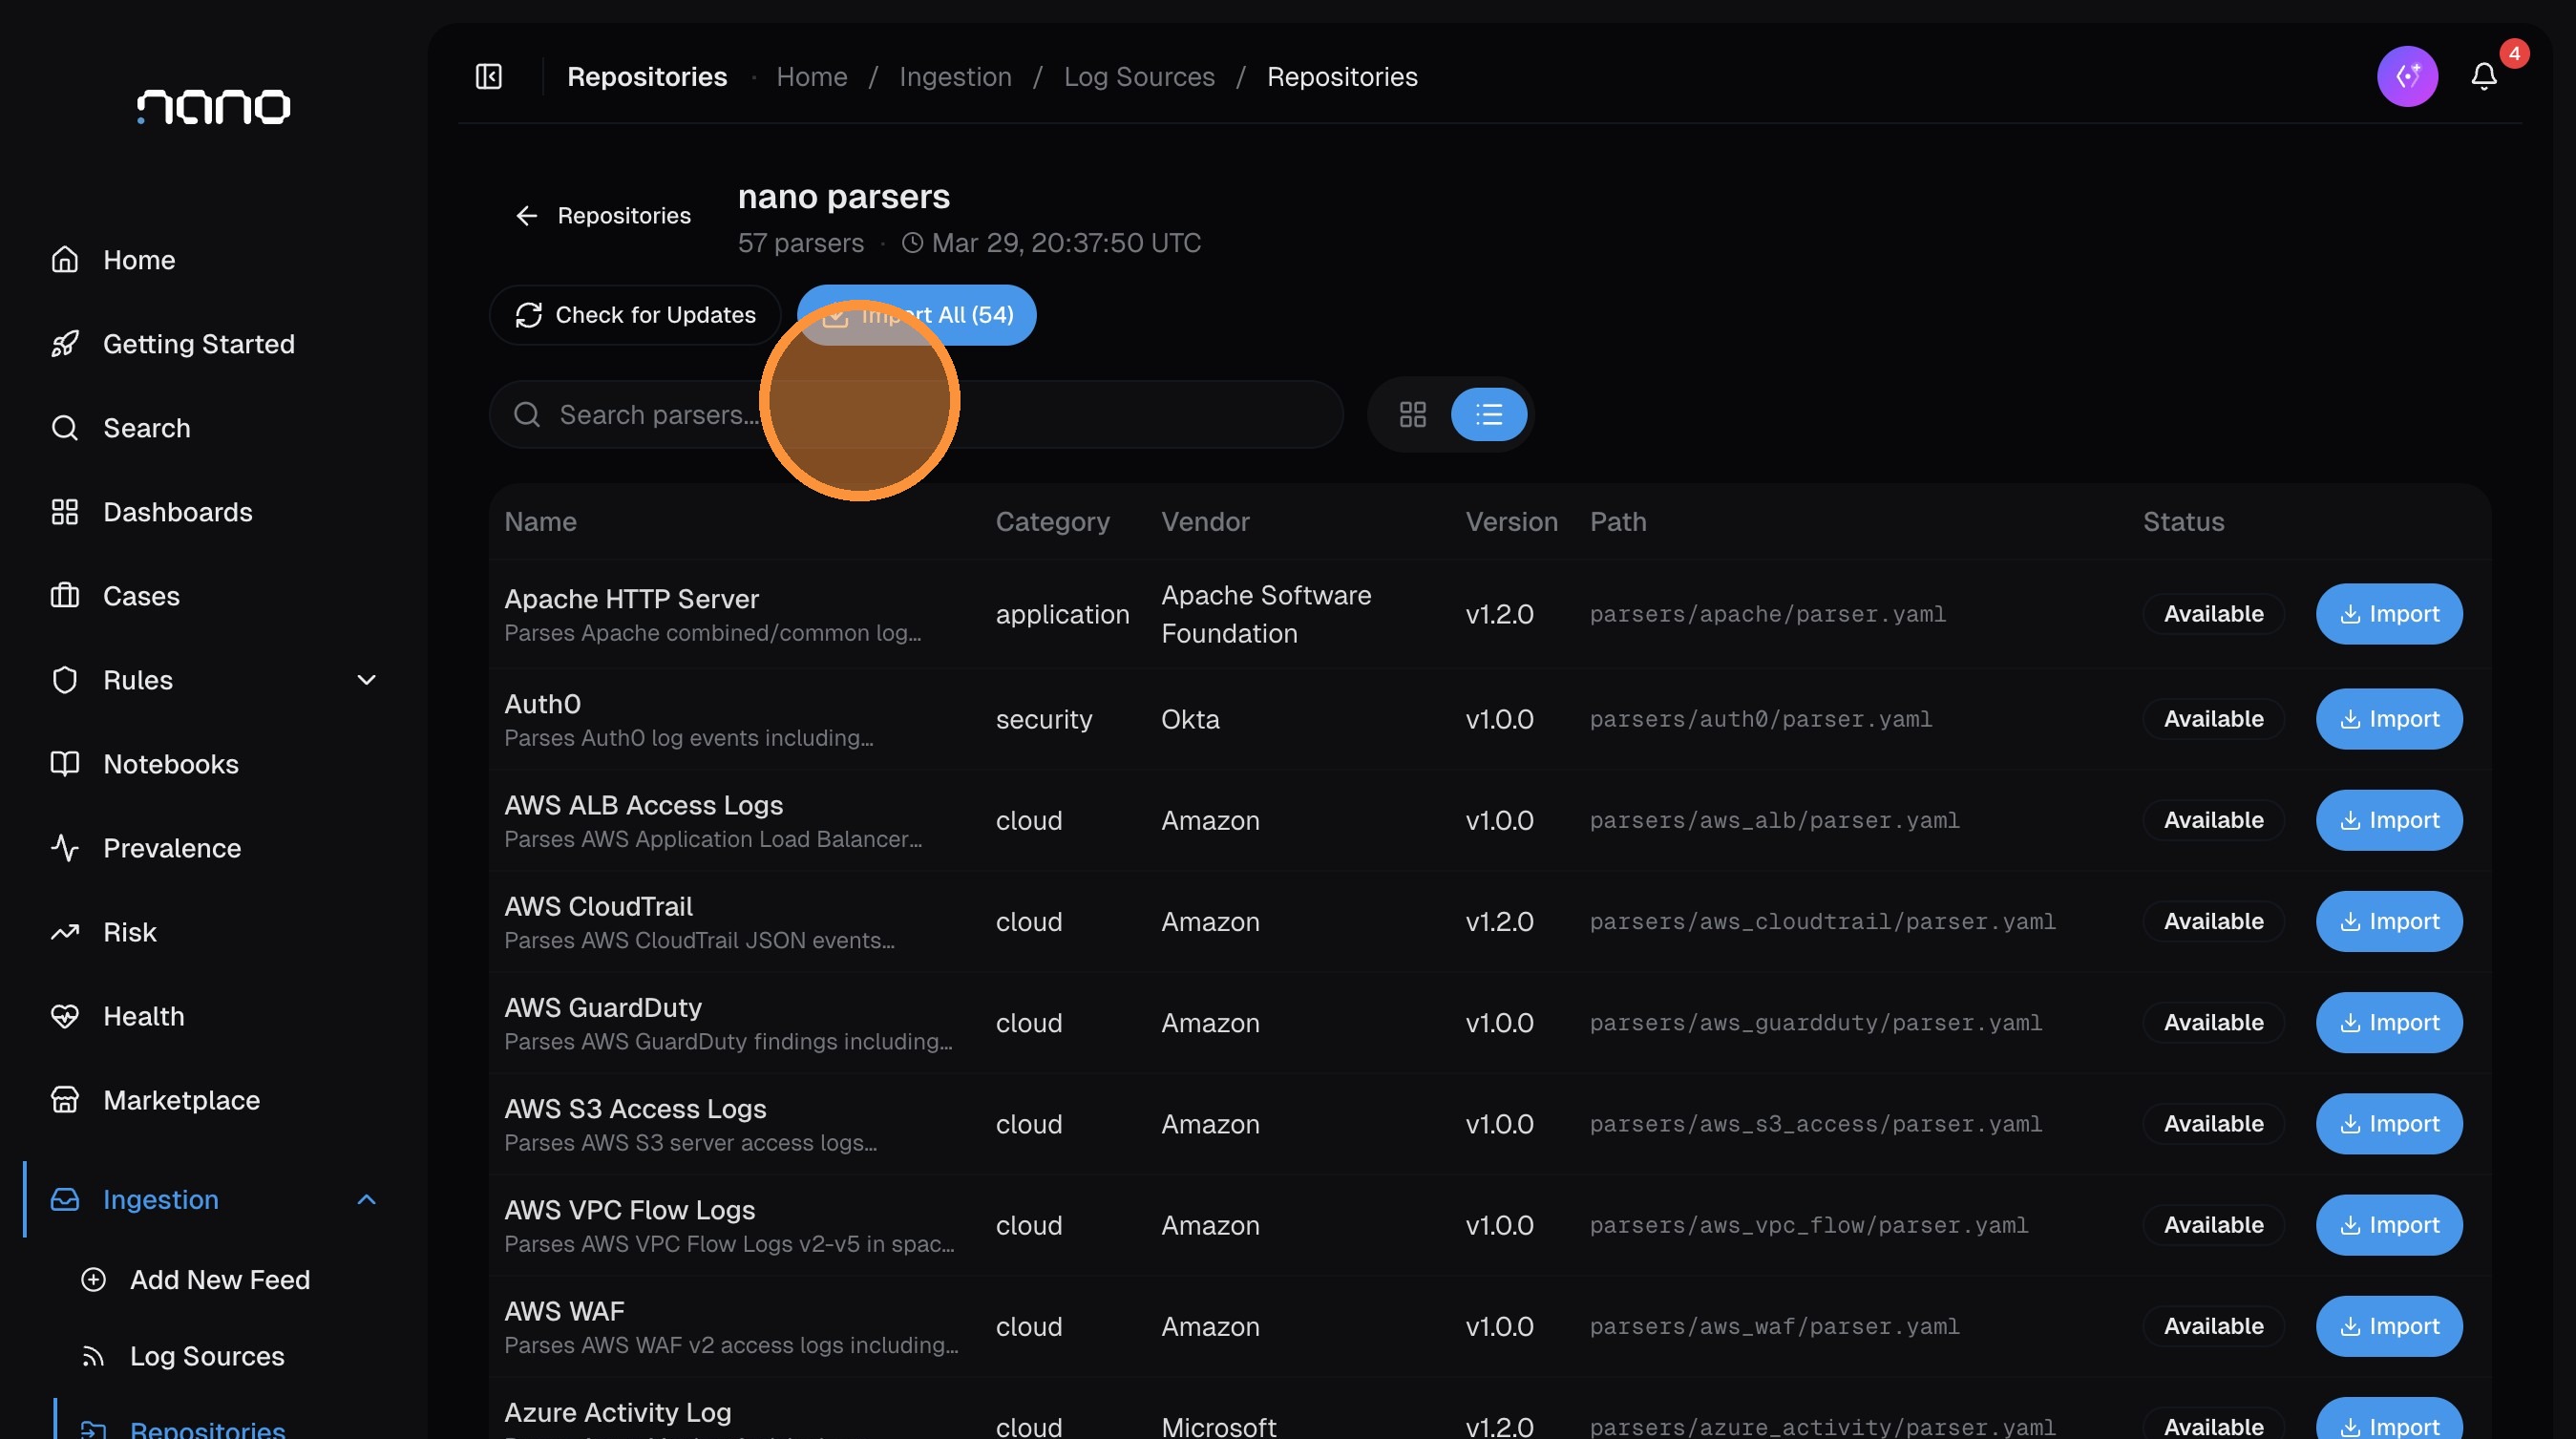
If the repository hasn't synced yet, click Check for Updates to pull the latest parsers. You can also click Import All to bring in every available parser at once.
Find and import a parser
Use the search bar to filter parsers. For example, type win to find Windows-related parsers:
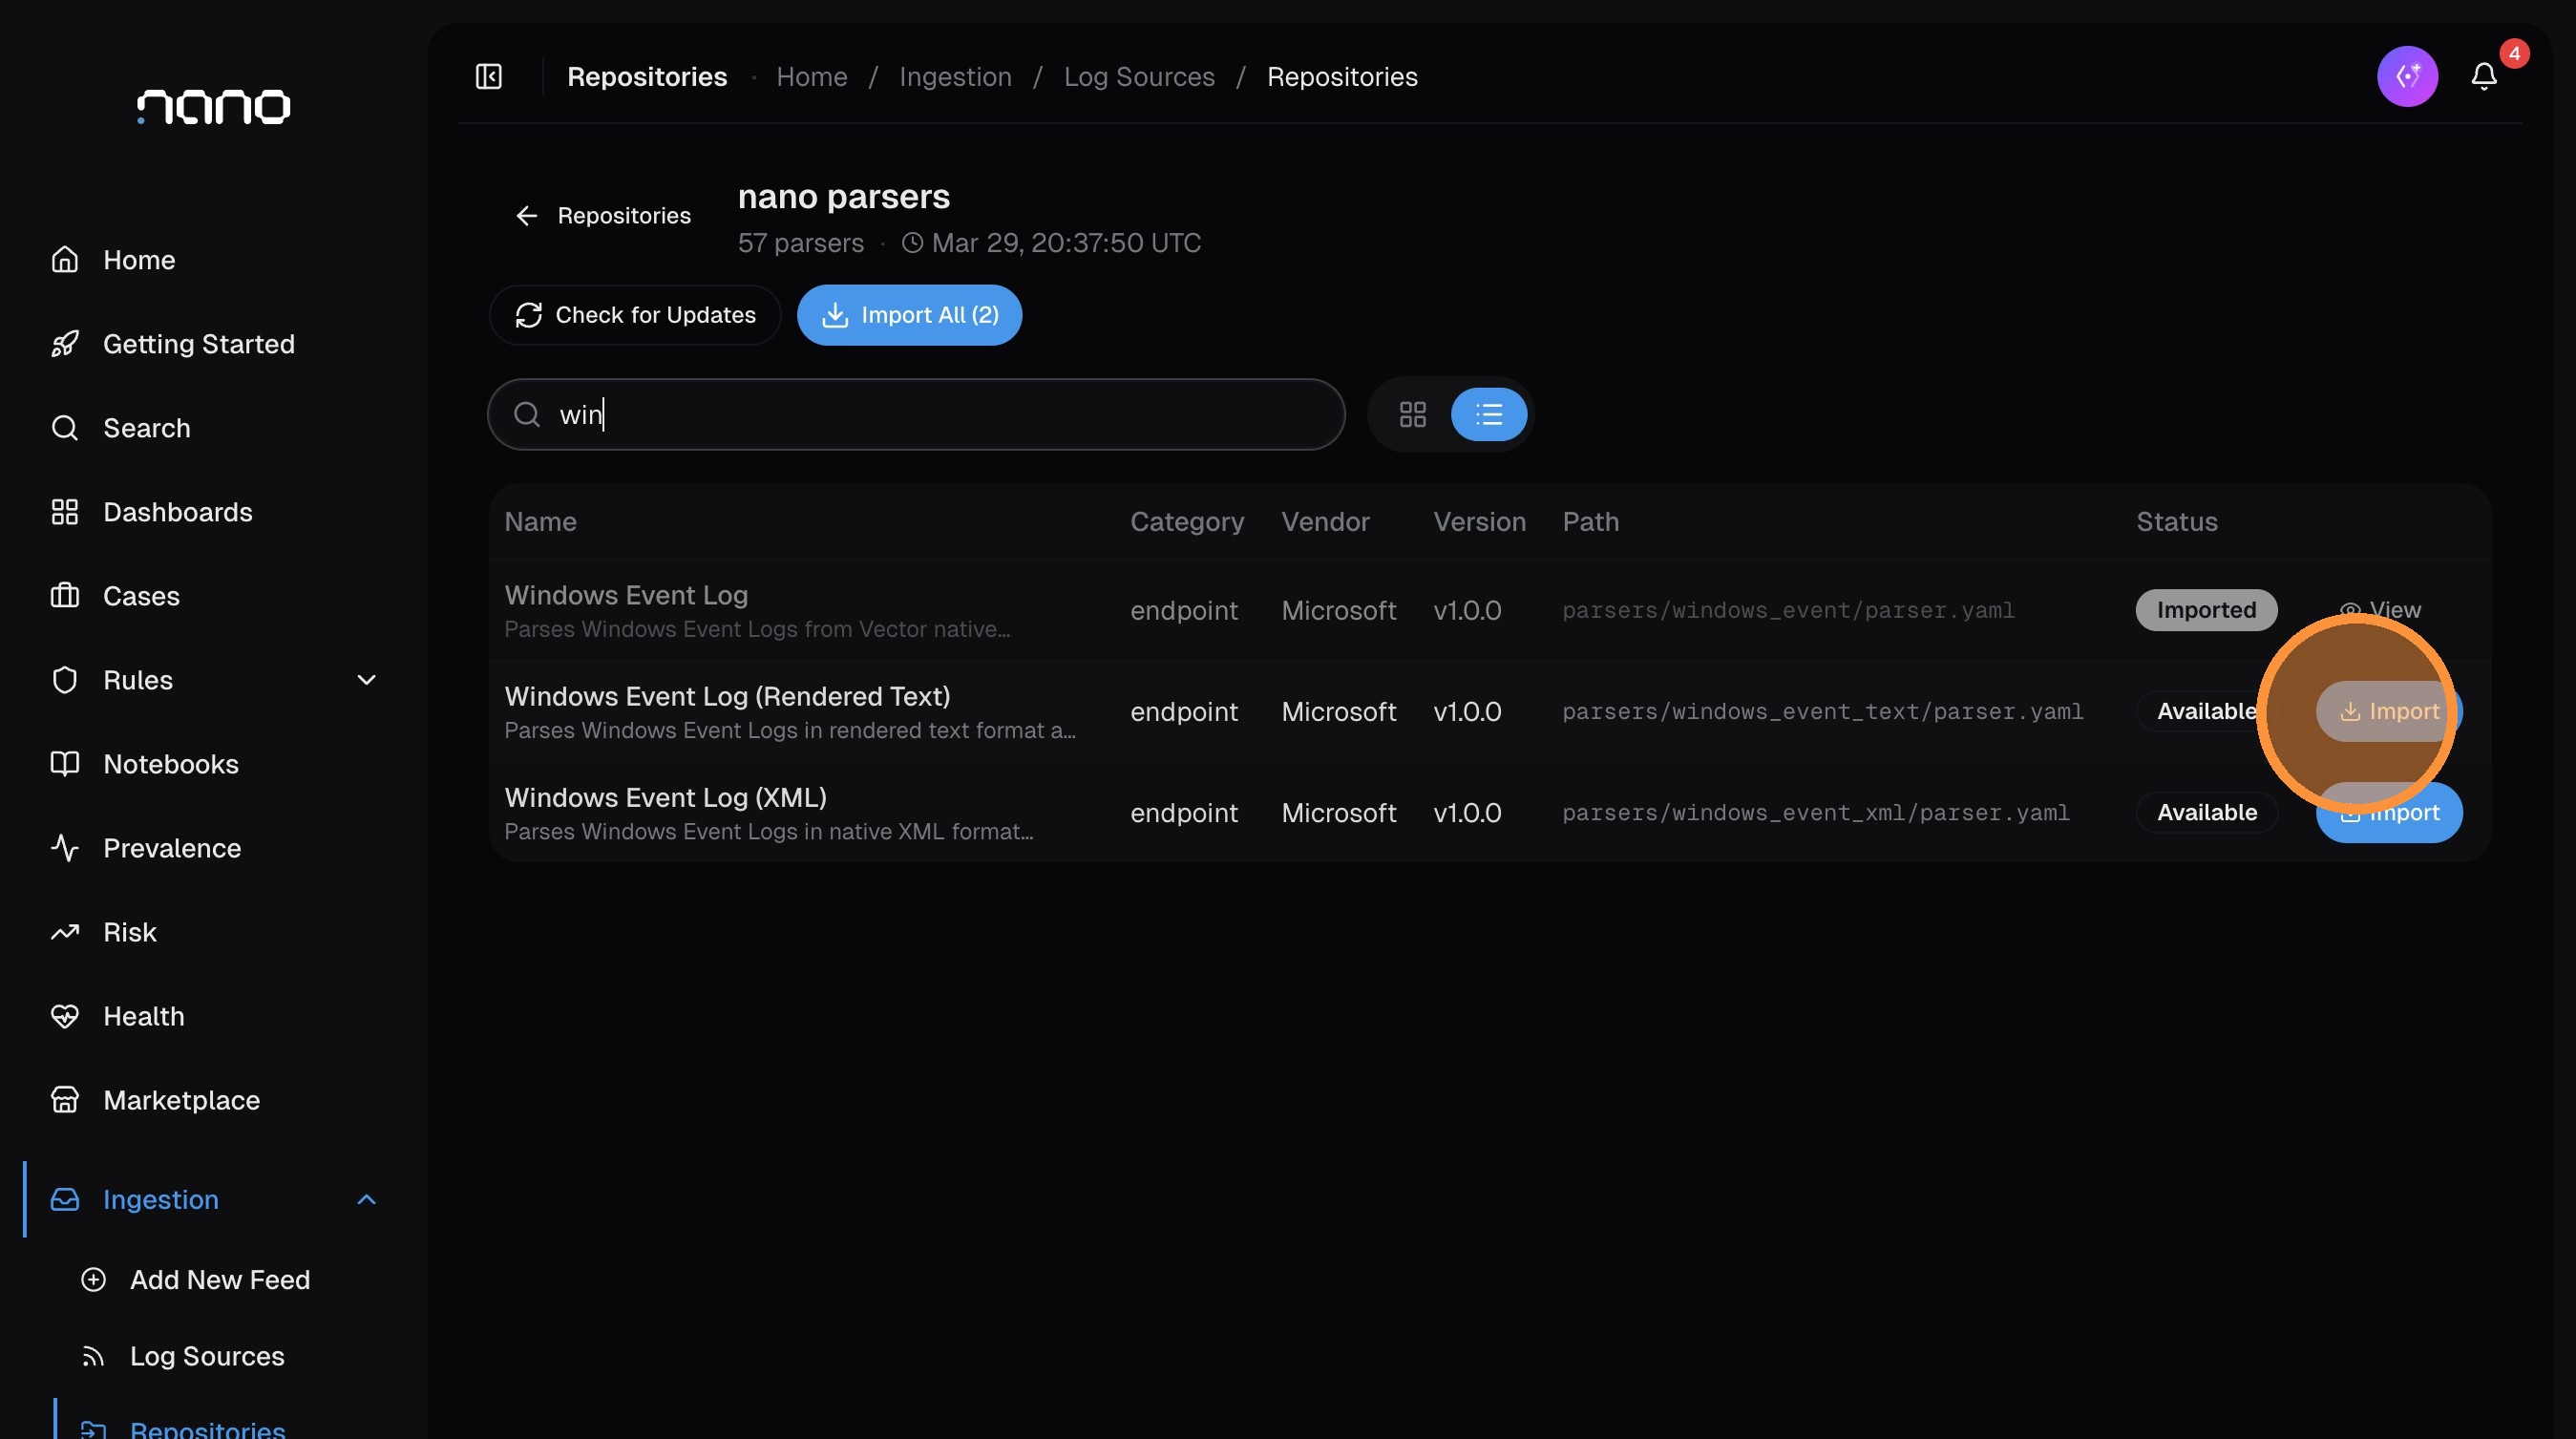
Click Import on the parser you want. An import dialog opens with the parser details pre-filled:
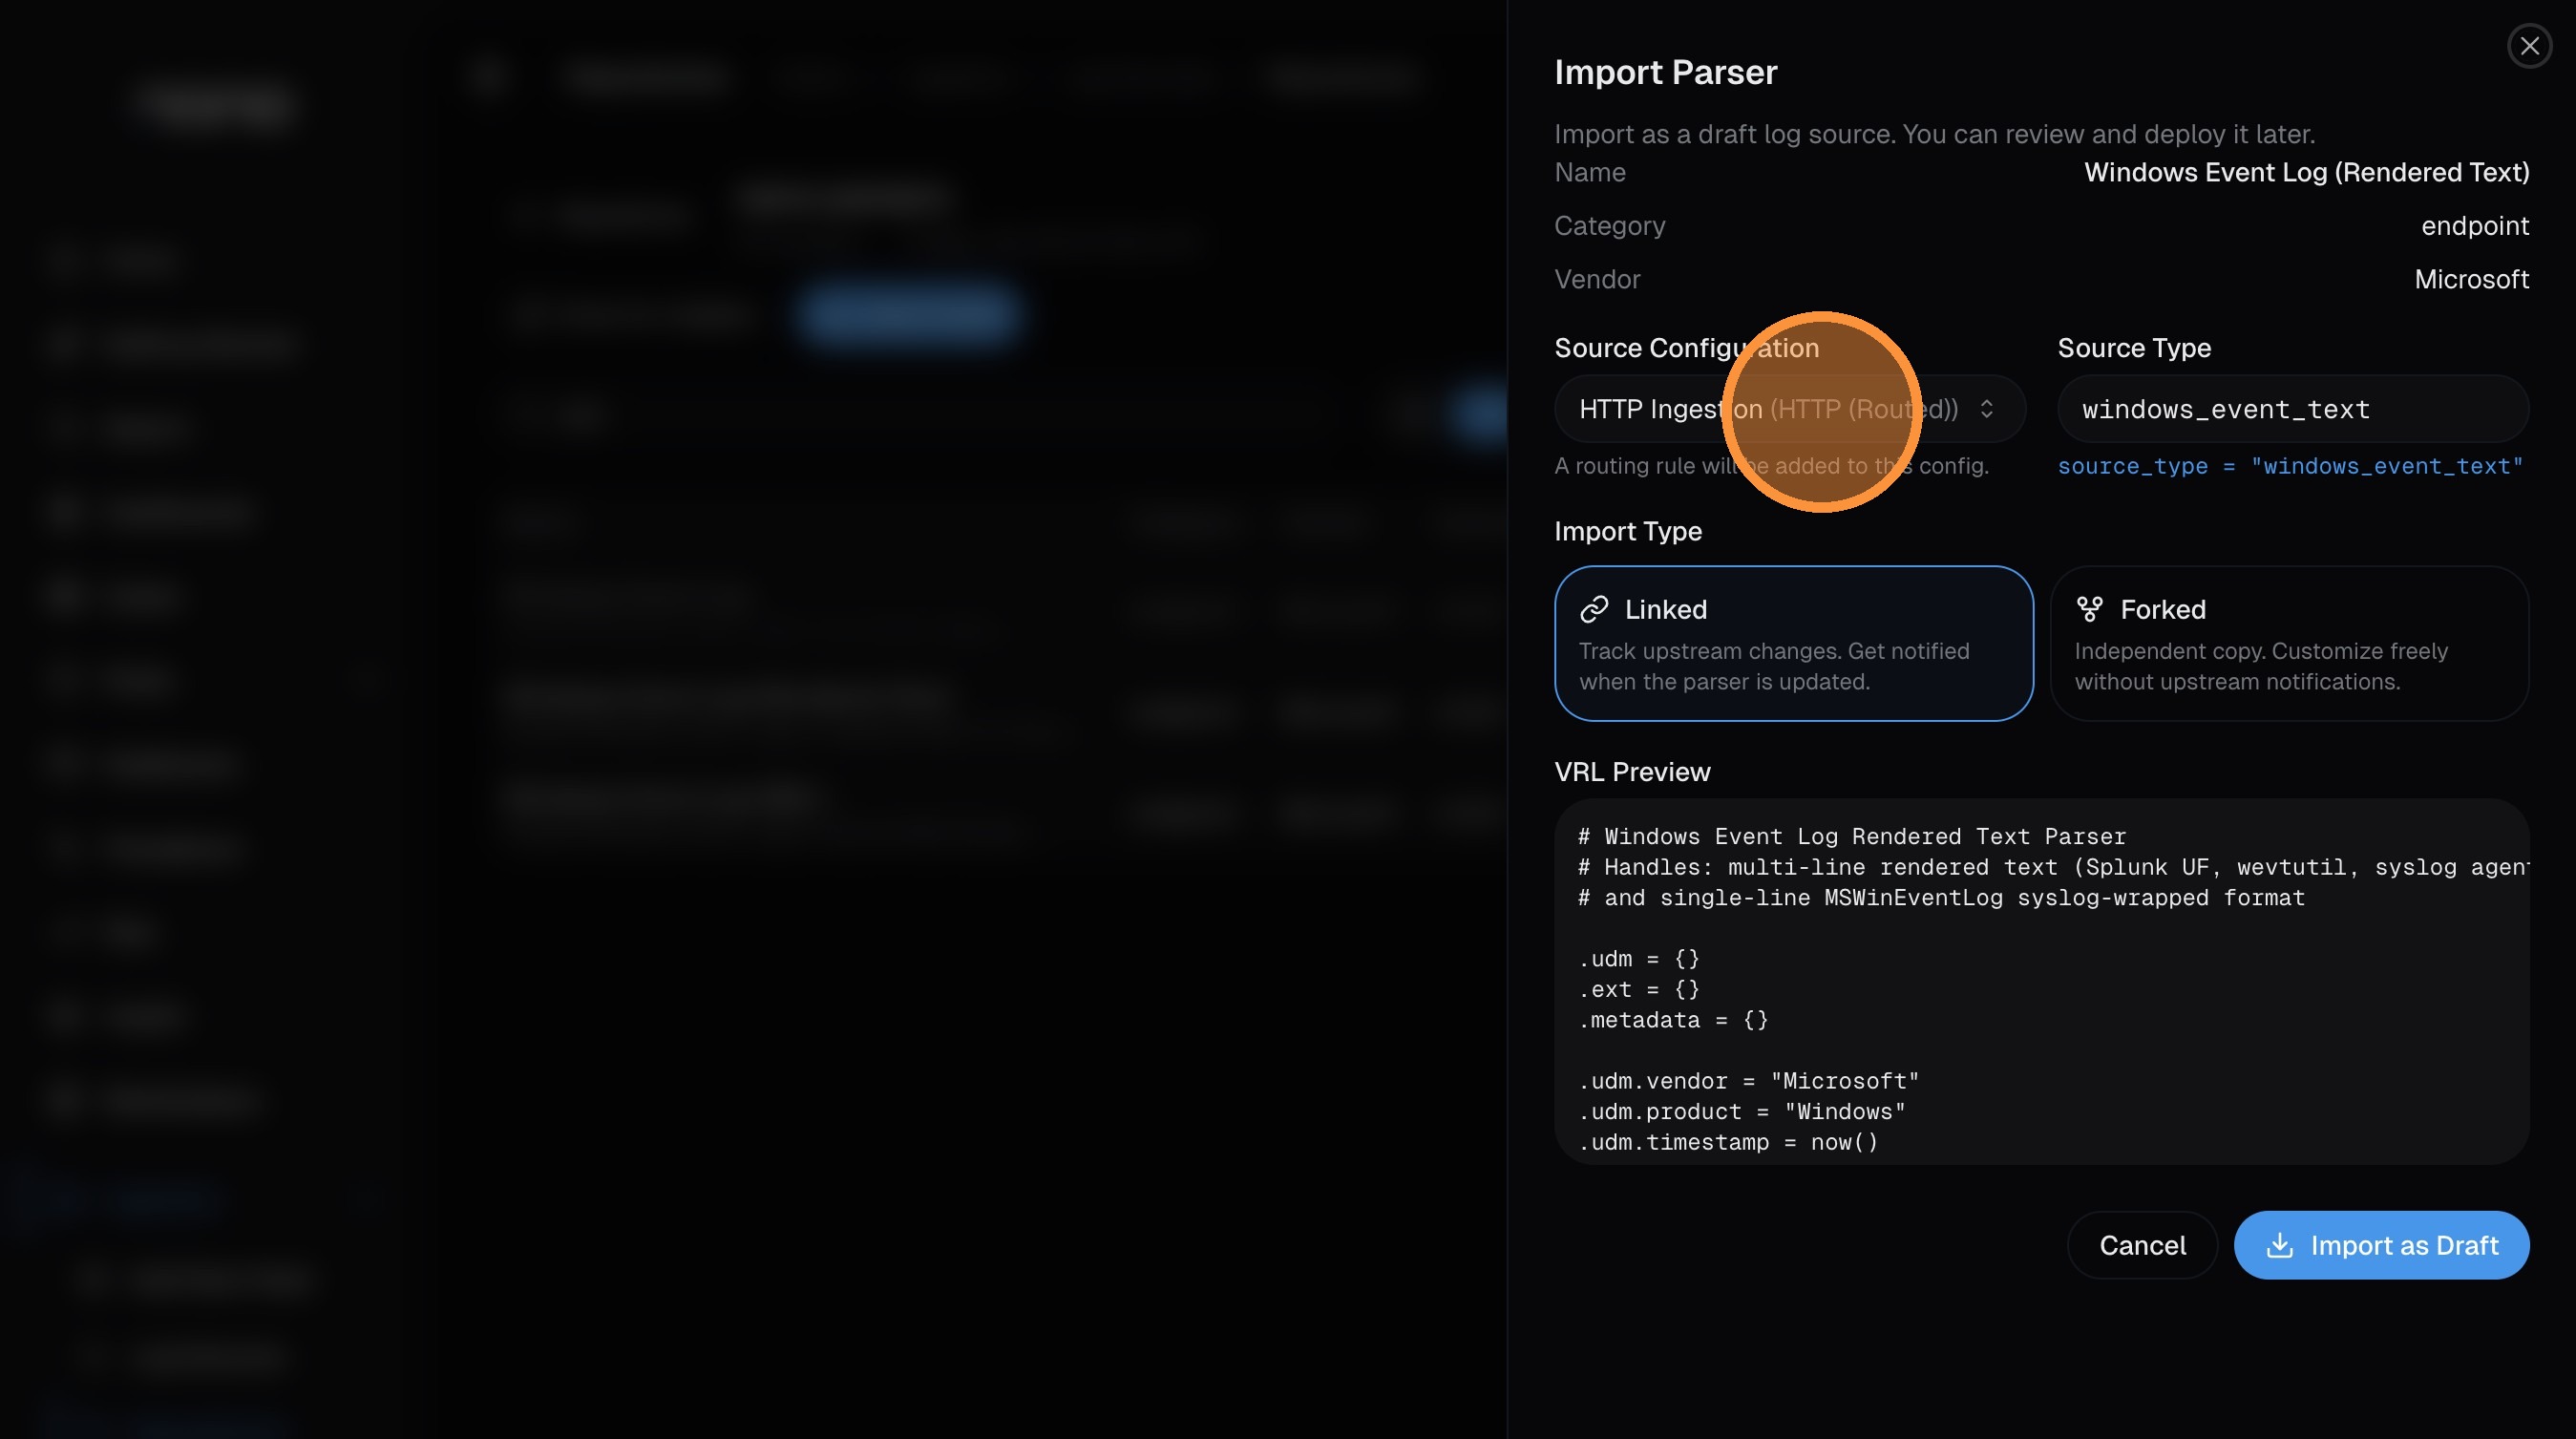
Configure the import
The import dialog has a few key fields:
-
Source Configuration — select which ingestion source this parser should receive logs from. The default HTTP Ingestion works for most setups. If you're using a Vector aggregator or another source, select it here.
-
Source Type — this is the identifier that routes incoming logs to this parser. It must match the
source_typevalue in your log data (set via theX-Source-TypeHTTP header, or by your Vector agent config). The parser sets a sensible default — only change it if your logs use a different value.
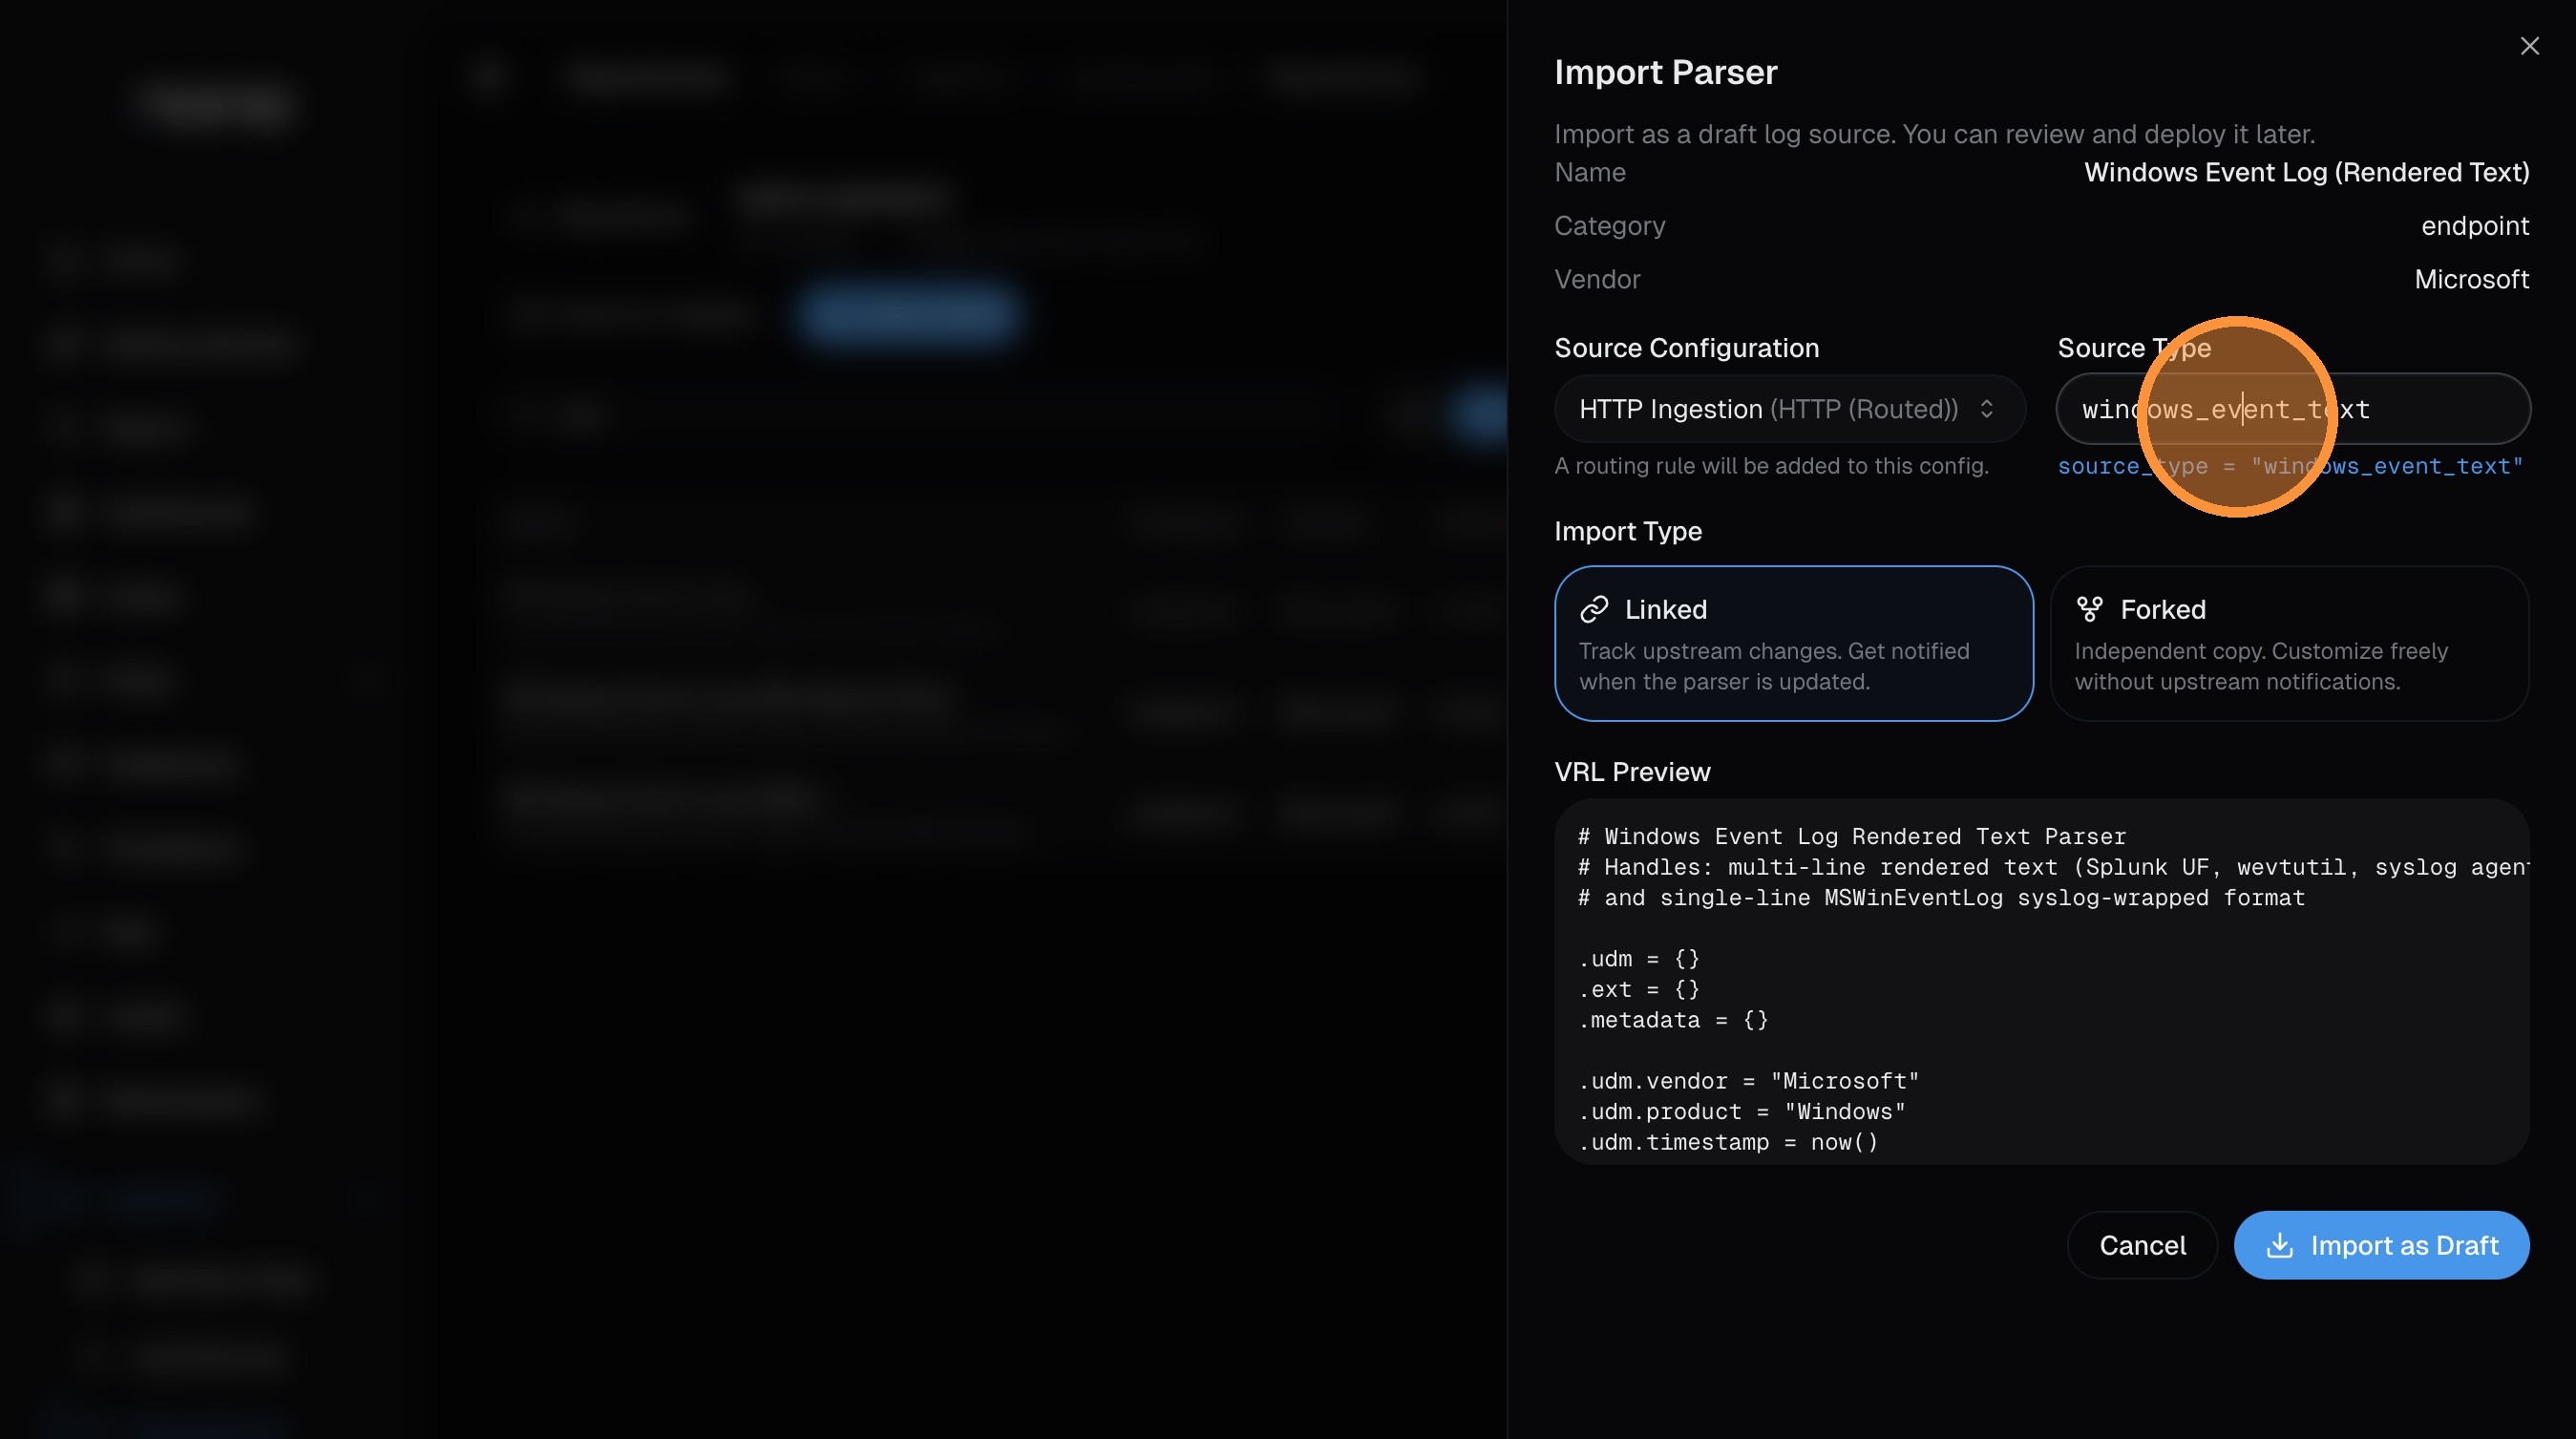
- Import Type — choose between:
- Linked — tracks upstream changes. You'll get notified when the parser is updated in the repository.
- Forked — creates an independent copy you can customize freely without upstream notifications.
The dialog also shows a VRL Preview of the parser code so you can see exactly what it does before importing.
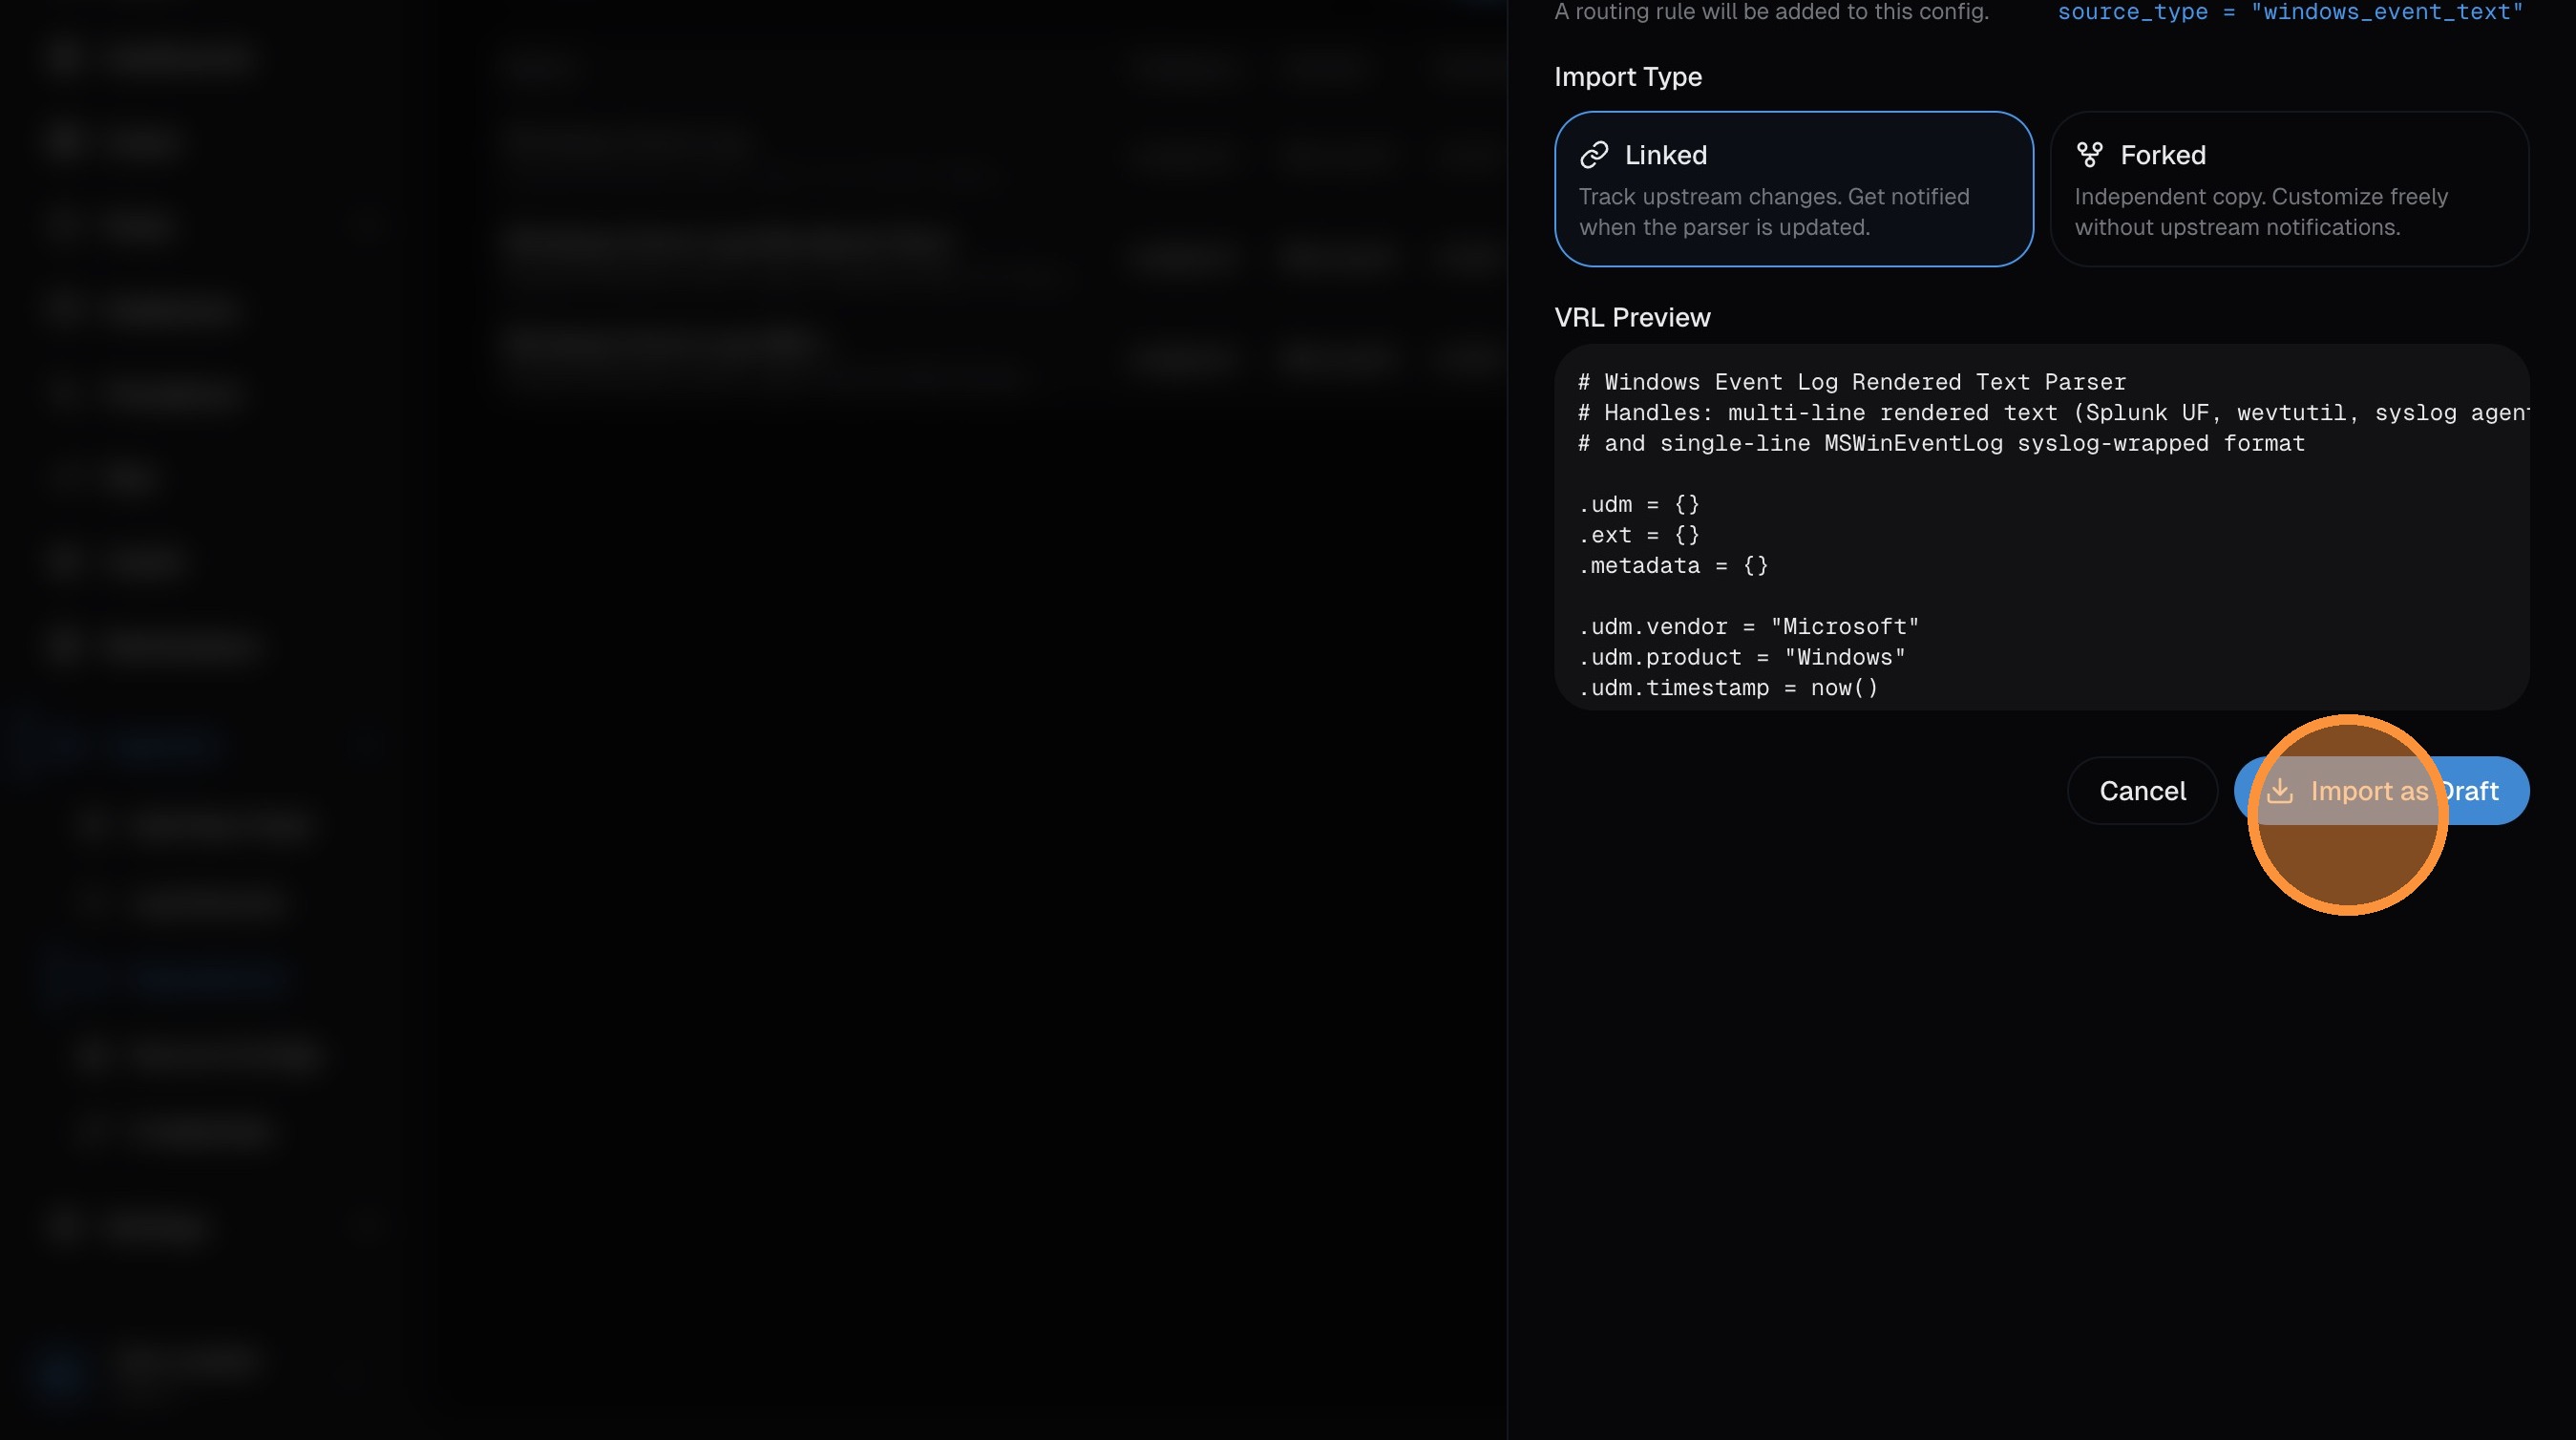
Import as draft
Click Import as Draft to create the feed. It imports as a draft so you can review before going live.
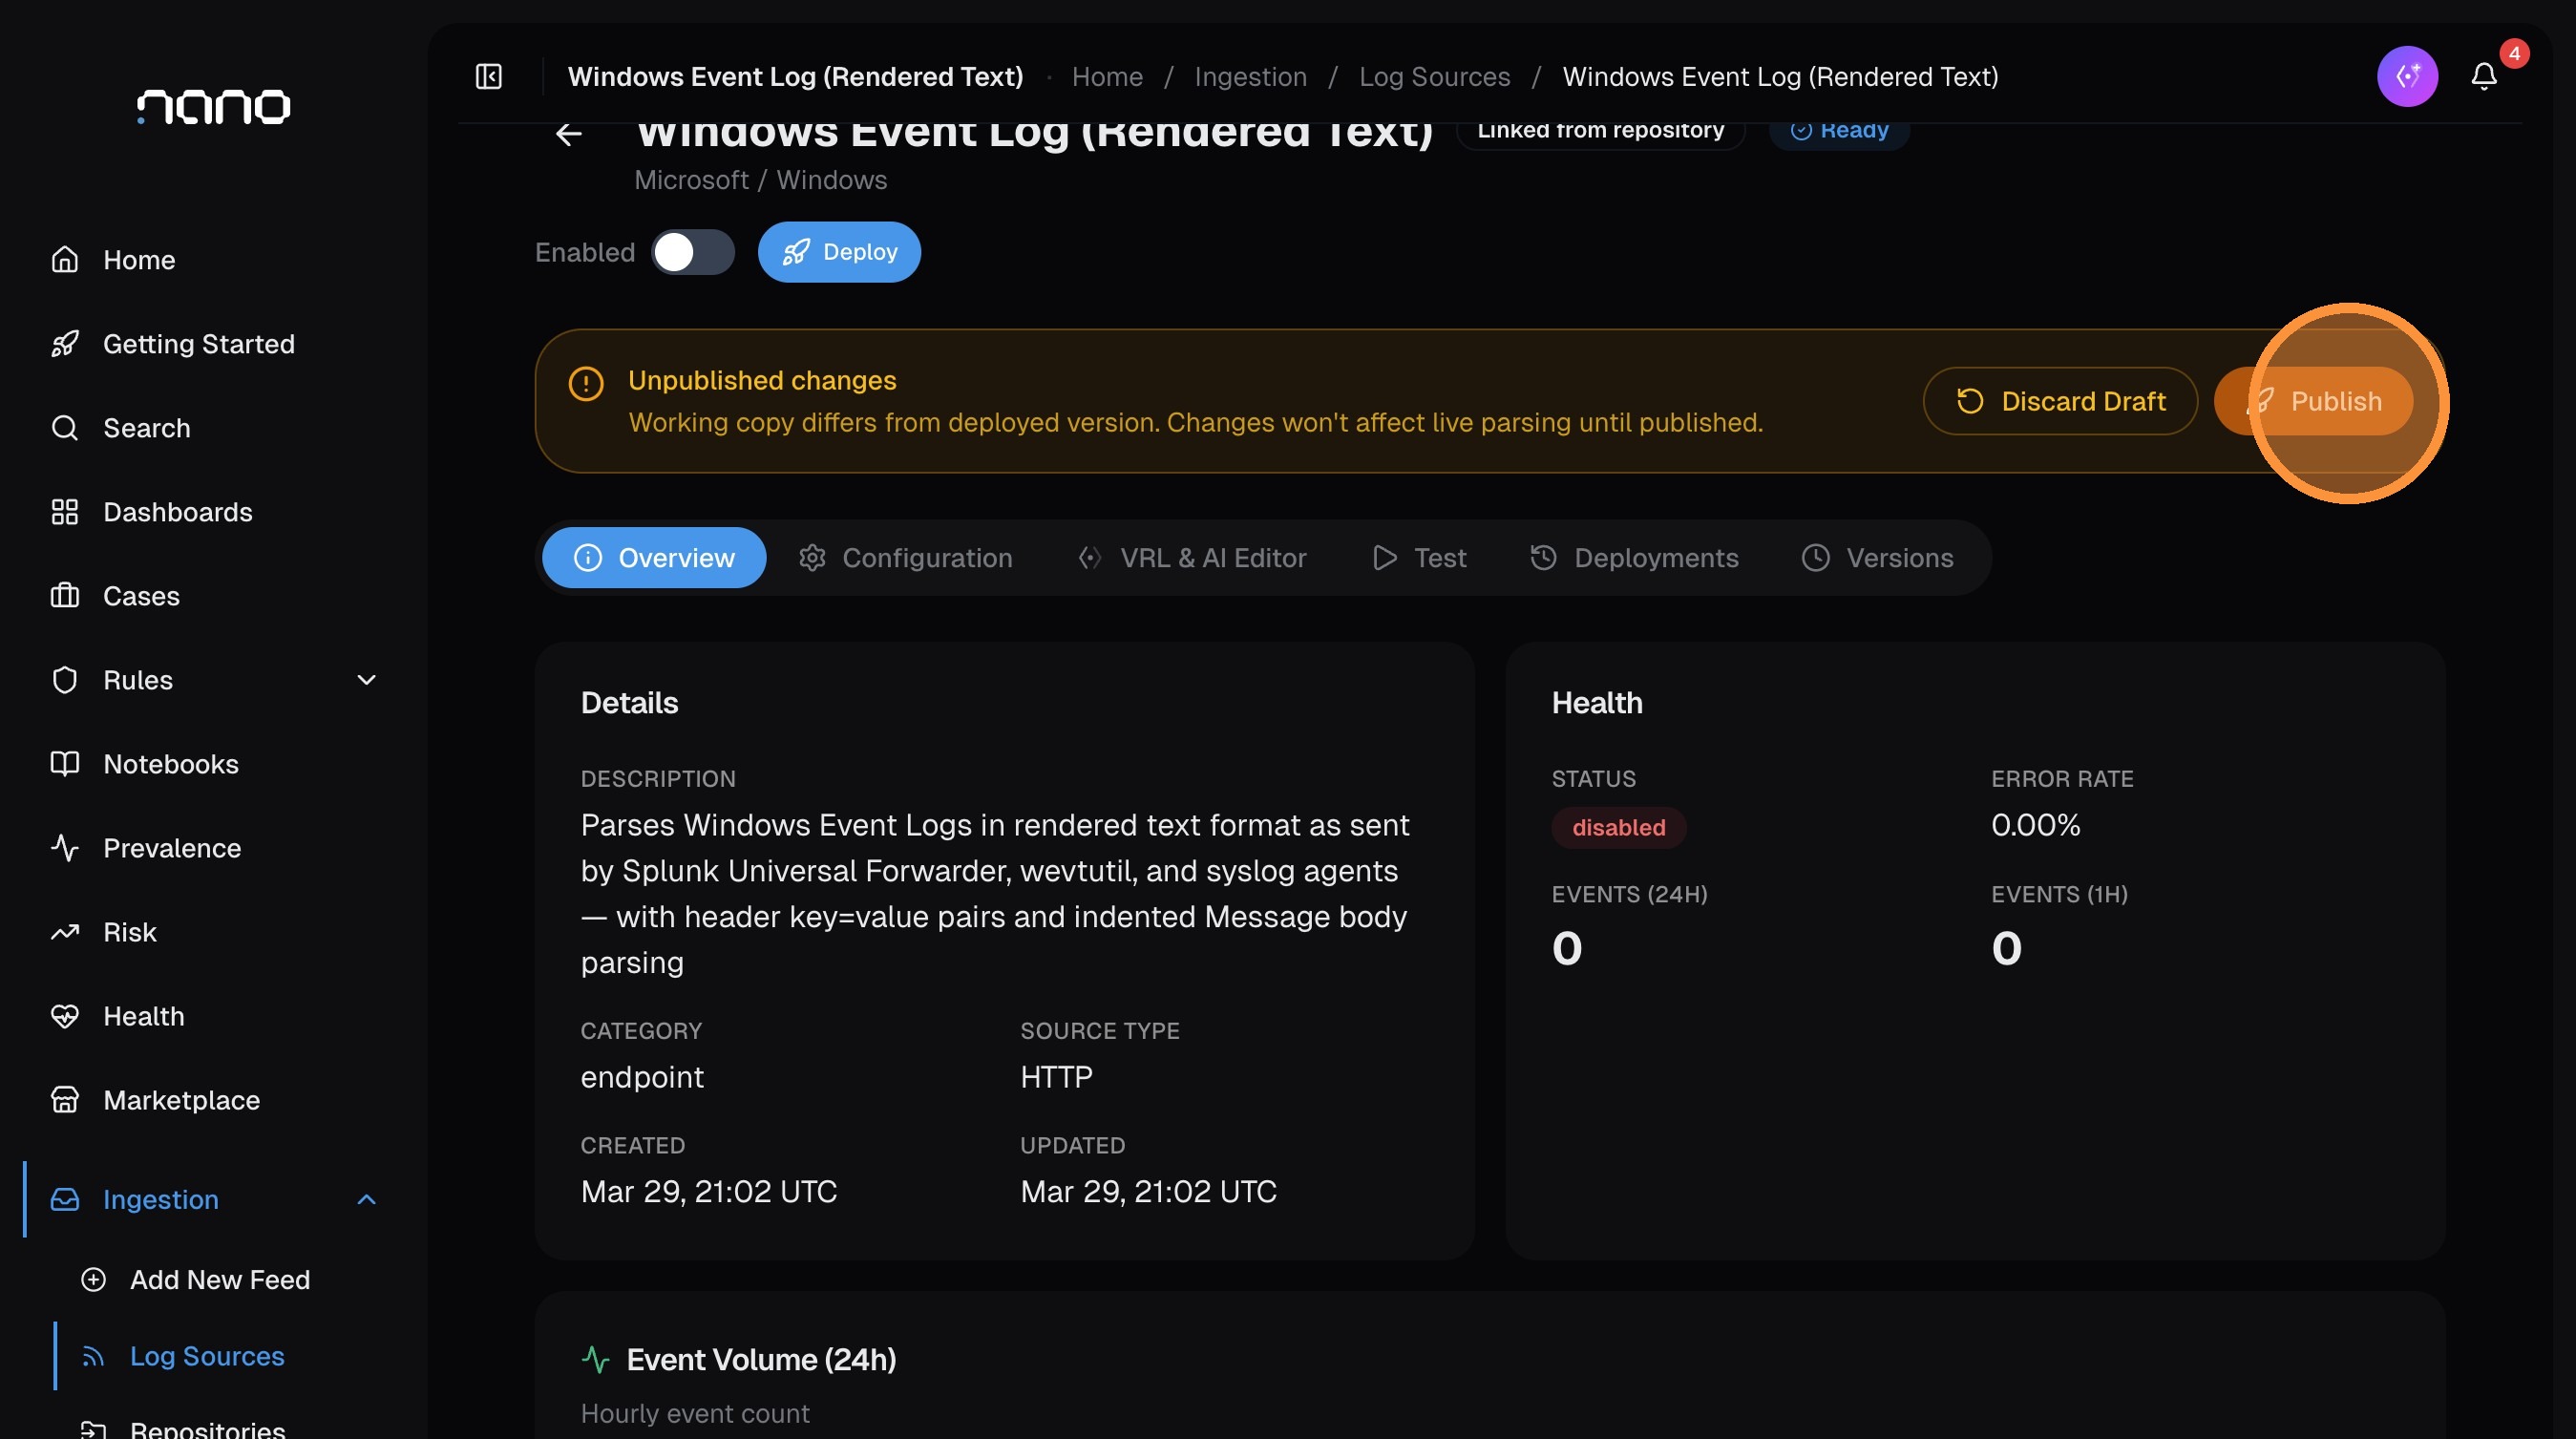
Step 5: Publish the Parser
After importing, you're taken to the log source detail page. The parser is in Ready state — imported but not yet active.
A yellow banner shows "Unpublished changes" — the parser needs to be published before it starts processing logs.
Click Publish:
Confirm in the dialog:
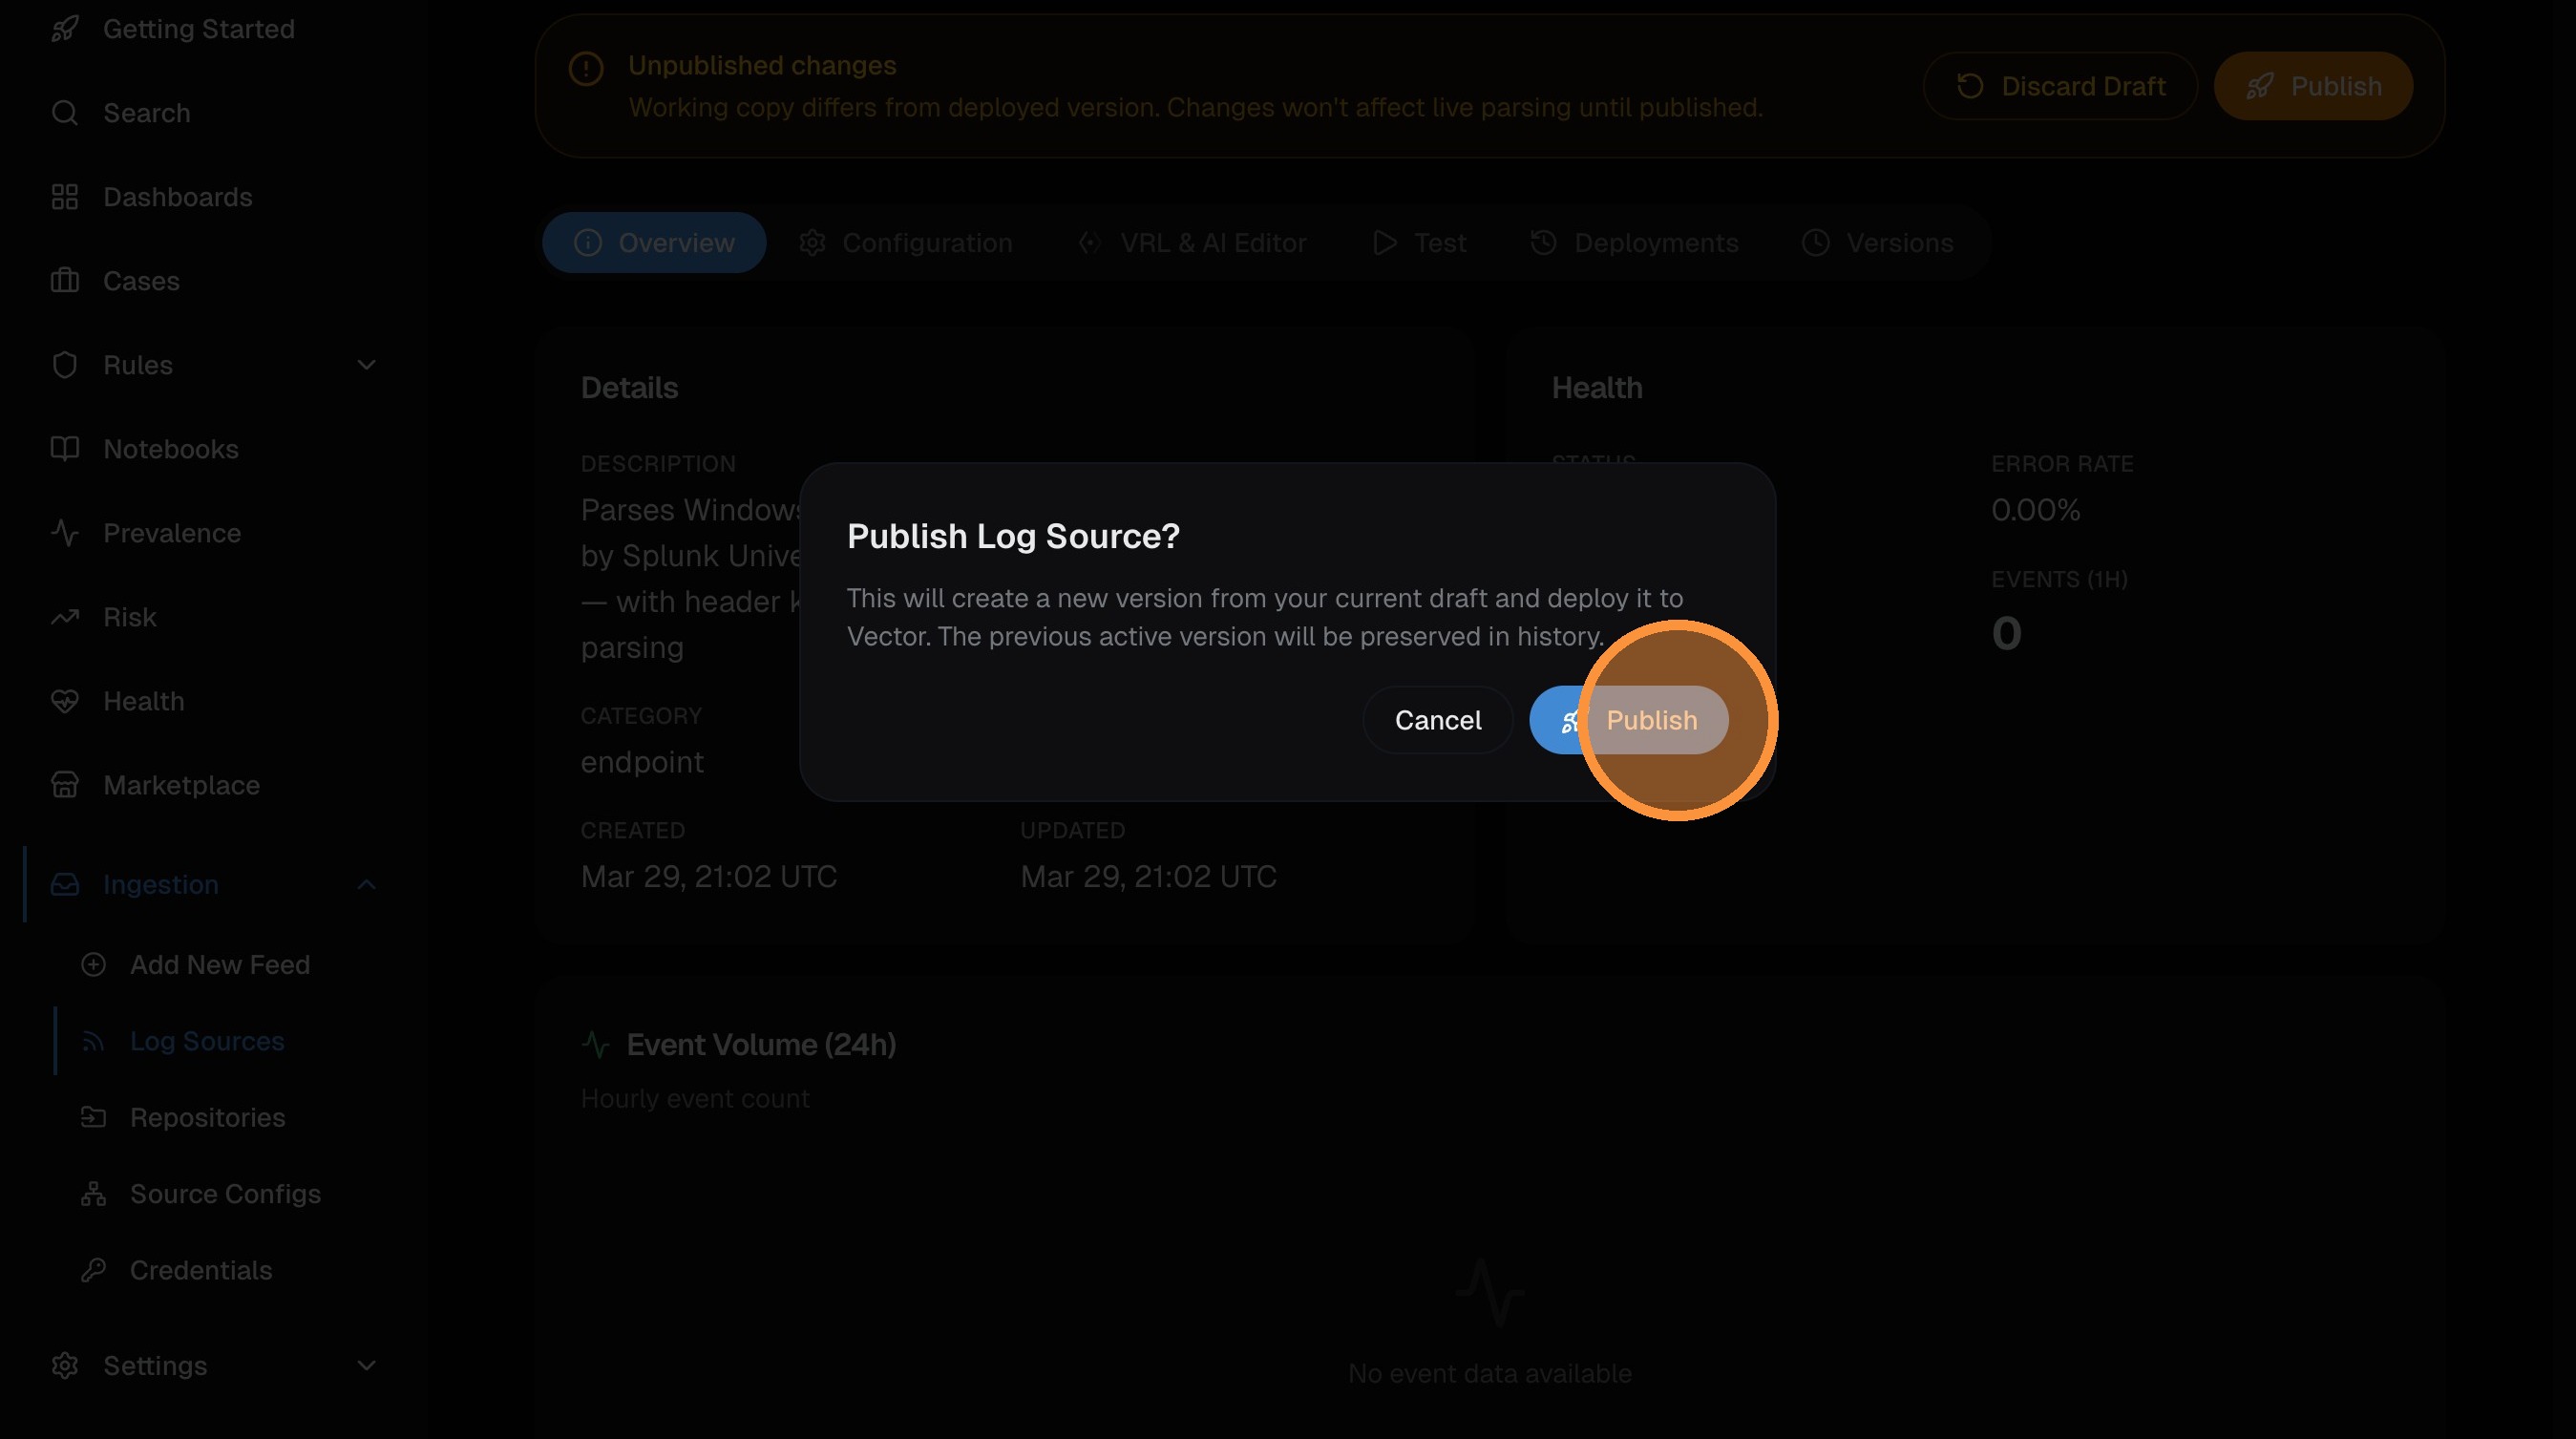
The parser is now Deployed and active. Events arriving with a matching source_type will be parsed and normalized automatically. Deployment to all Vector pods takes ~40 seconds.
Step 6: Customize (Optional)
Once published, you can review and customize the parser from the log source detail page:
- Configuration tab — edit metadata (vendor, product, category), configure staleness monitoring (get alerted if the source stops sending data), and set up event sampling for high-volume sources
- VRL & AI Editor tab — modify the parser's VRL code, use the AI to help rewrite or improve it, and test against sample events
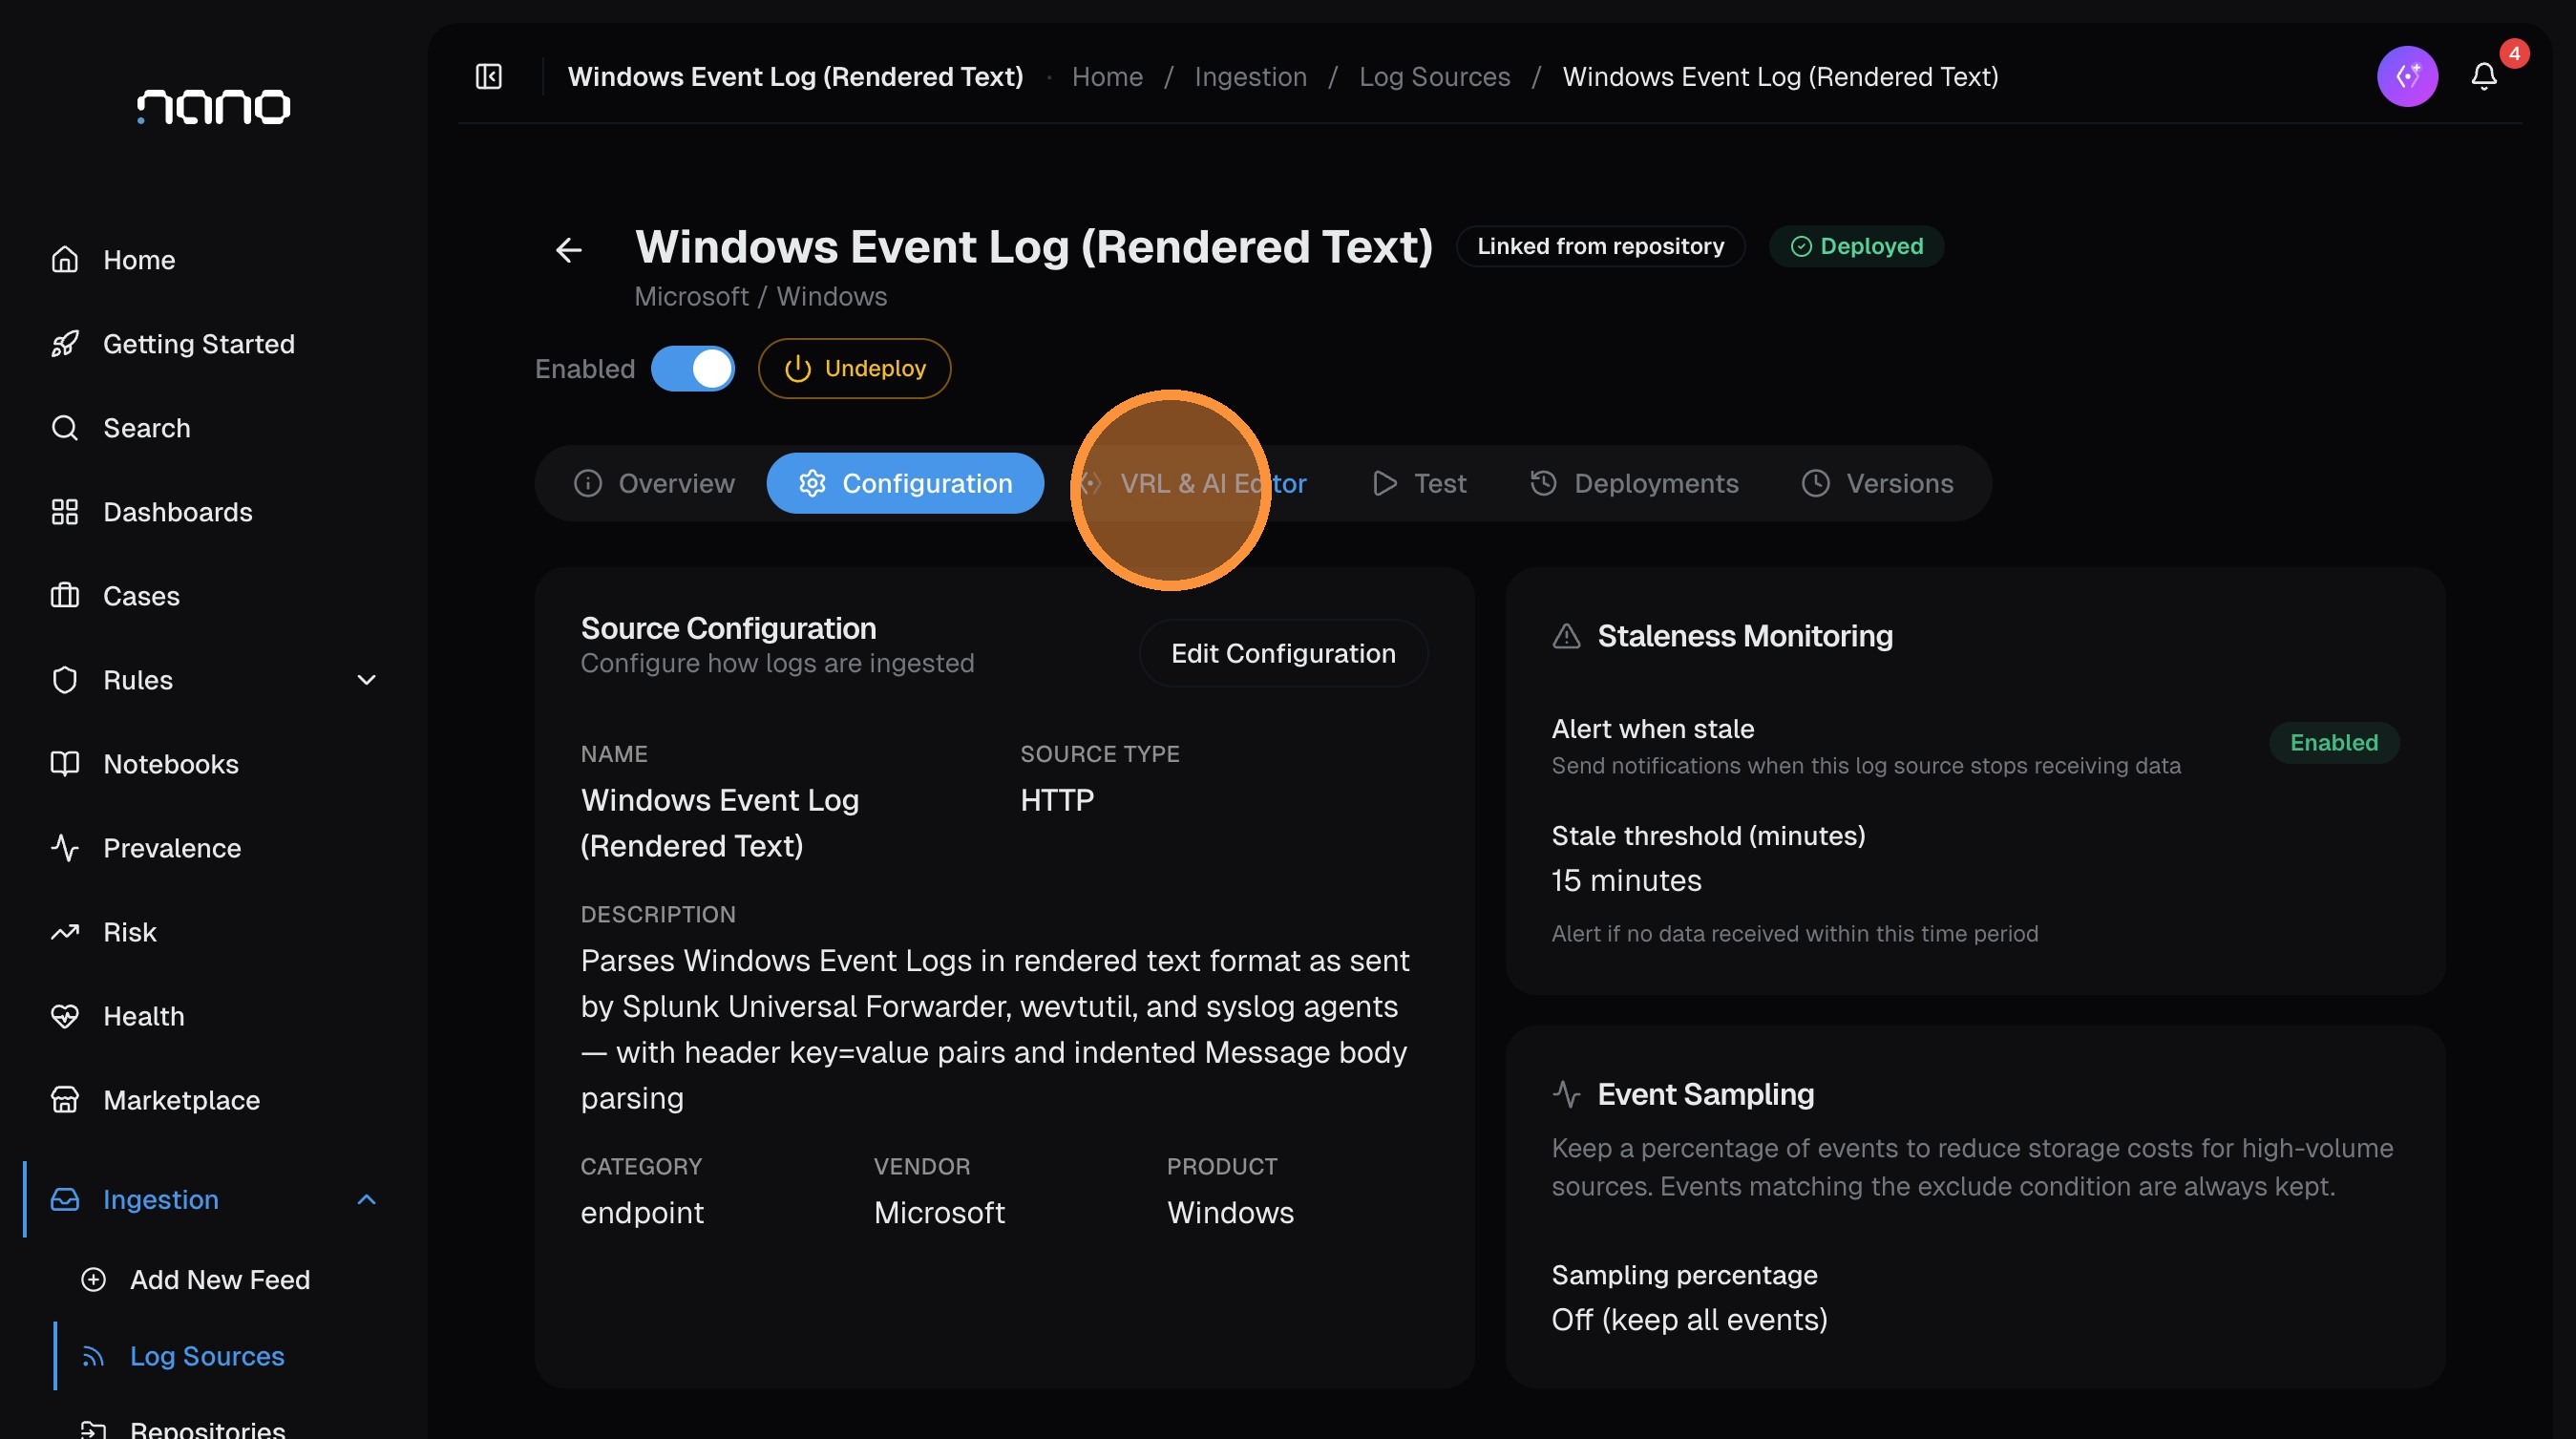
If you make changes, the "Unpublished changes" banner reappears — click Publish again to deploy the updated parser. nano keeps a version history under the Versions tab, so you can always roll back if needed.
Step 7: Verify
Run a search to confirm events are being parsed. Replace the source type with yours:
source_type="windows_event" | head 10If the parser is working, you'll see structured fields populated in the results — src_ip, user, action, process_name, etc. — instead of just a raw message field.
If no events appear yet, check that:
- Your log shipper or Vector agent is sending data with the correct
source_type - The ingestion token in your shipper config matches the one from your deployment
- The source configuration (HTTP, Vector, etc.) matches how your logs are arriving
Alternative: Create a Custom Feed with the Wizard
If your log source isn't in the repository — or you have a custom format — use the Log Source Wizard to build a parser from scratch. The AI generates the parser code from sample logs you provide.
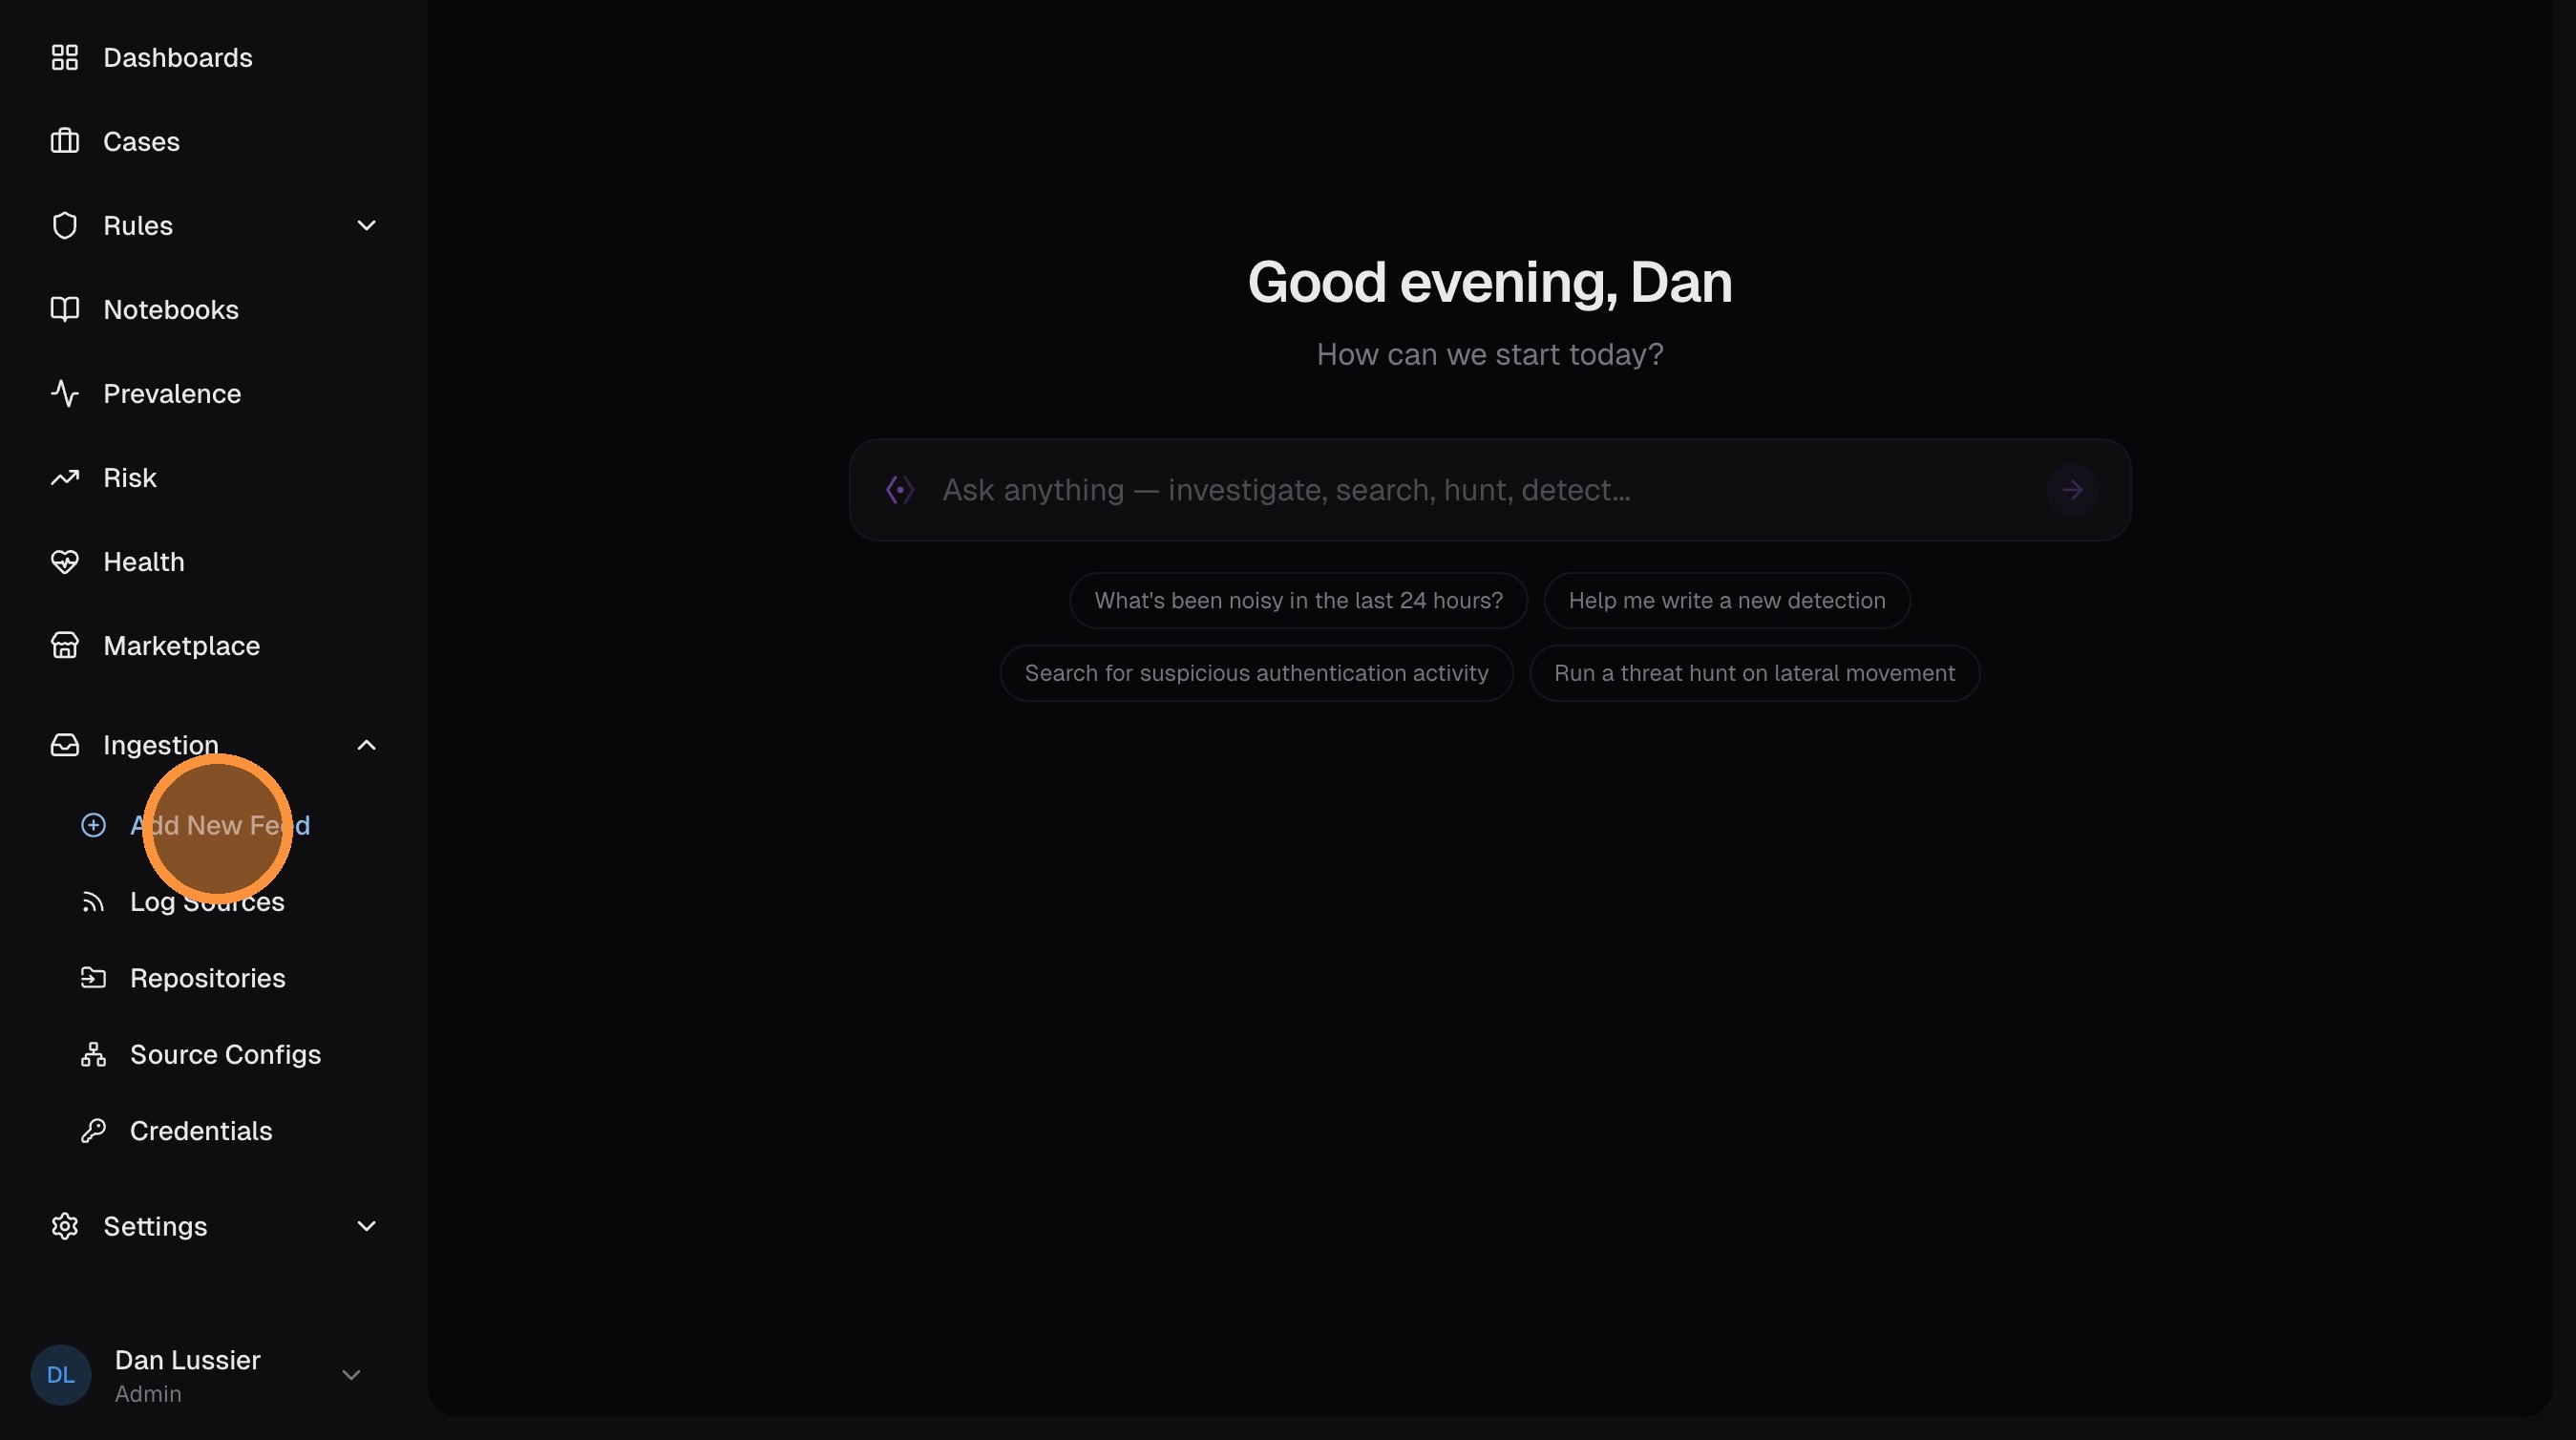
Open the wizard
From the Log Sources page, click Add New Feed.
Select your ingestion source
Choose how logs will arrive. For most setups, select HTTP — this works with any log shipper, webhook, or script that can send HTTP POST requests.
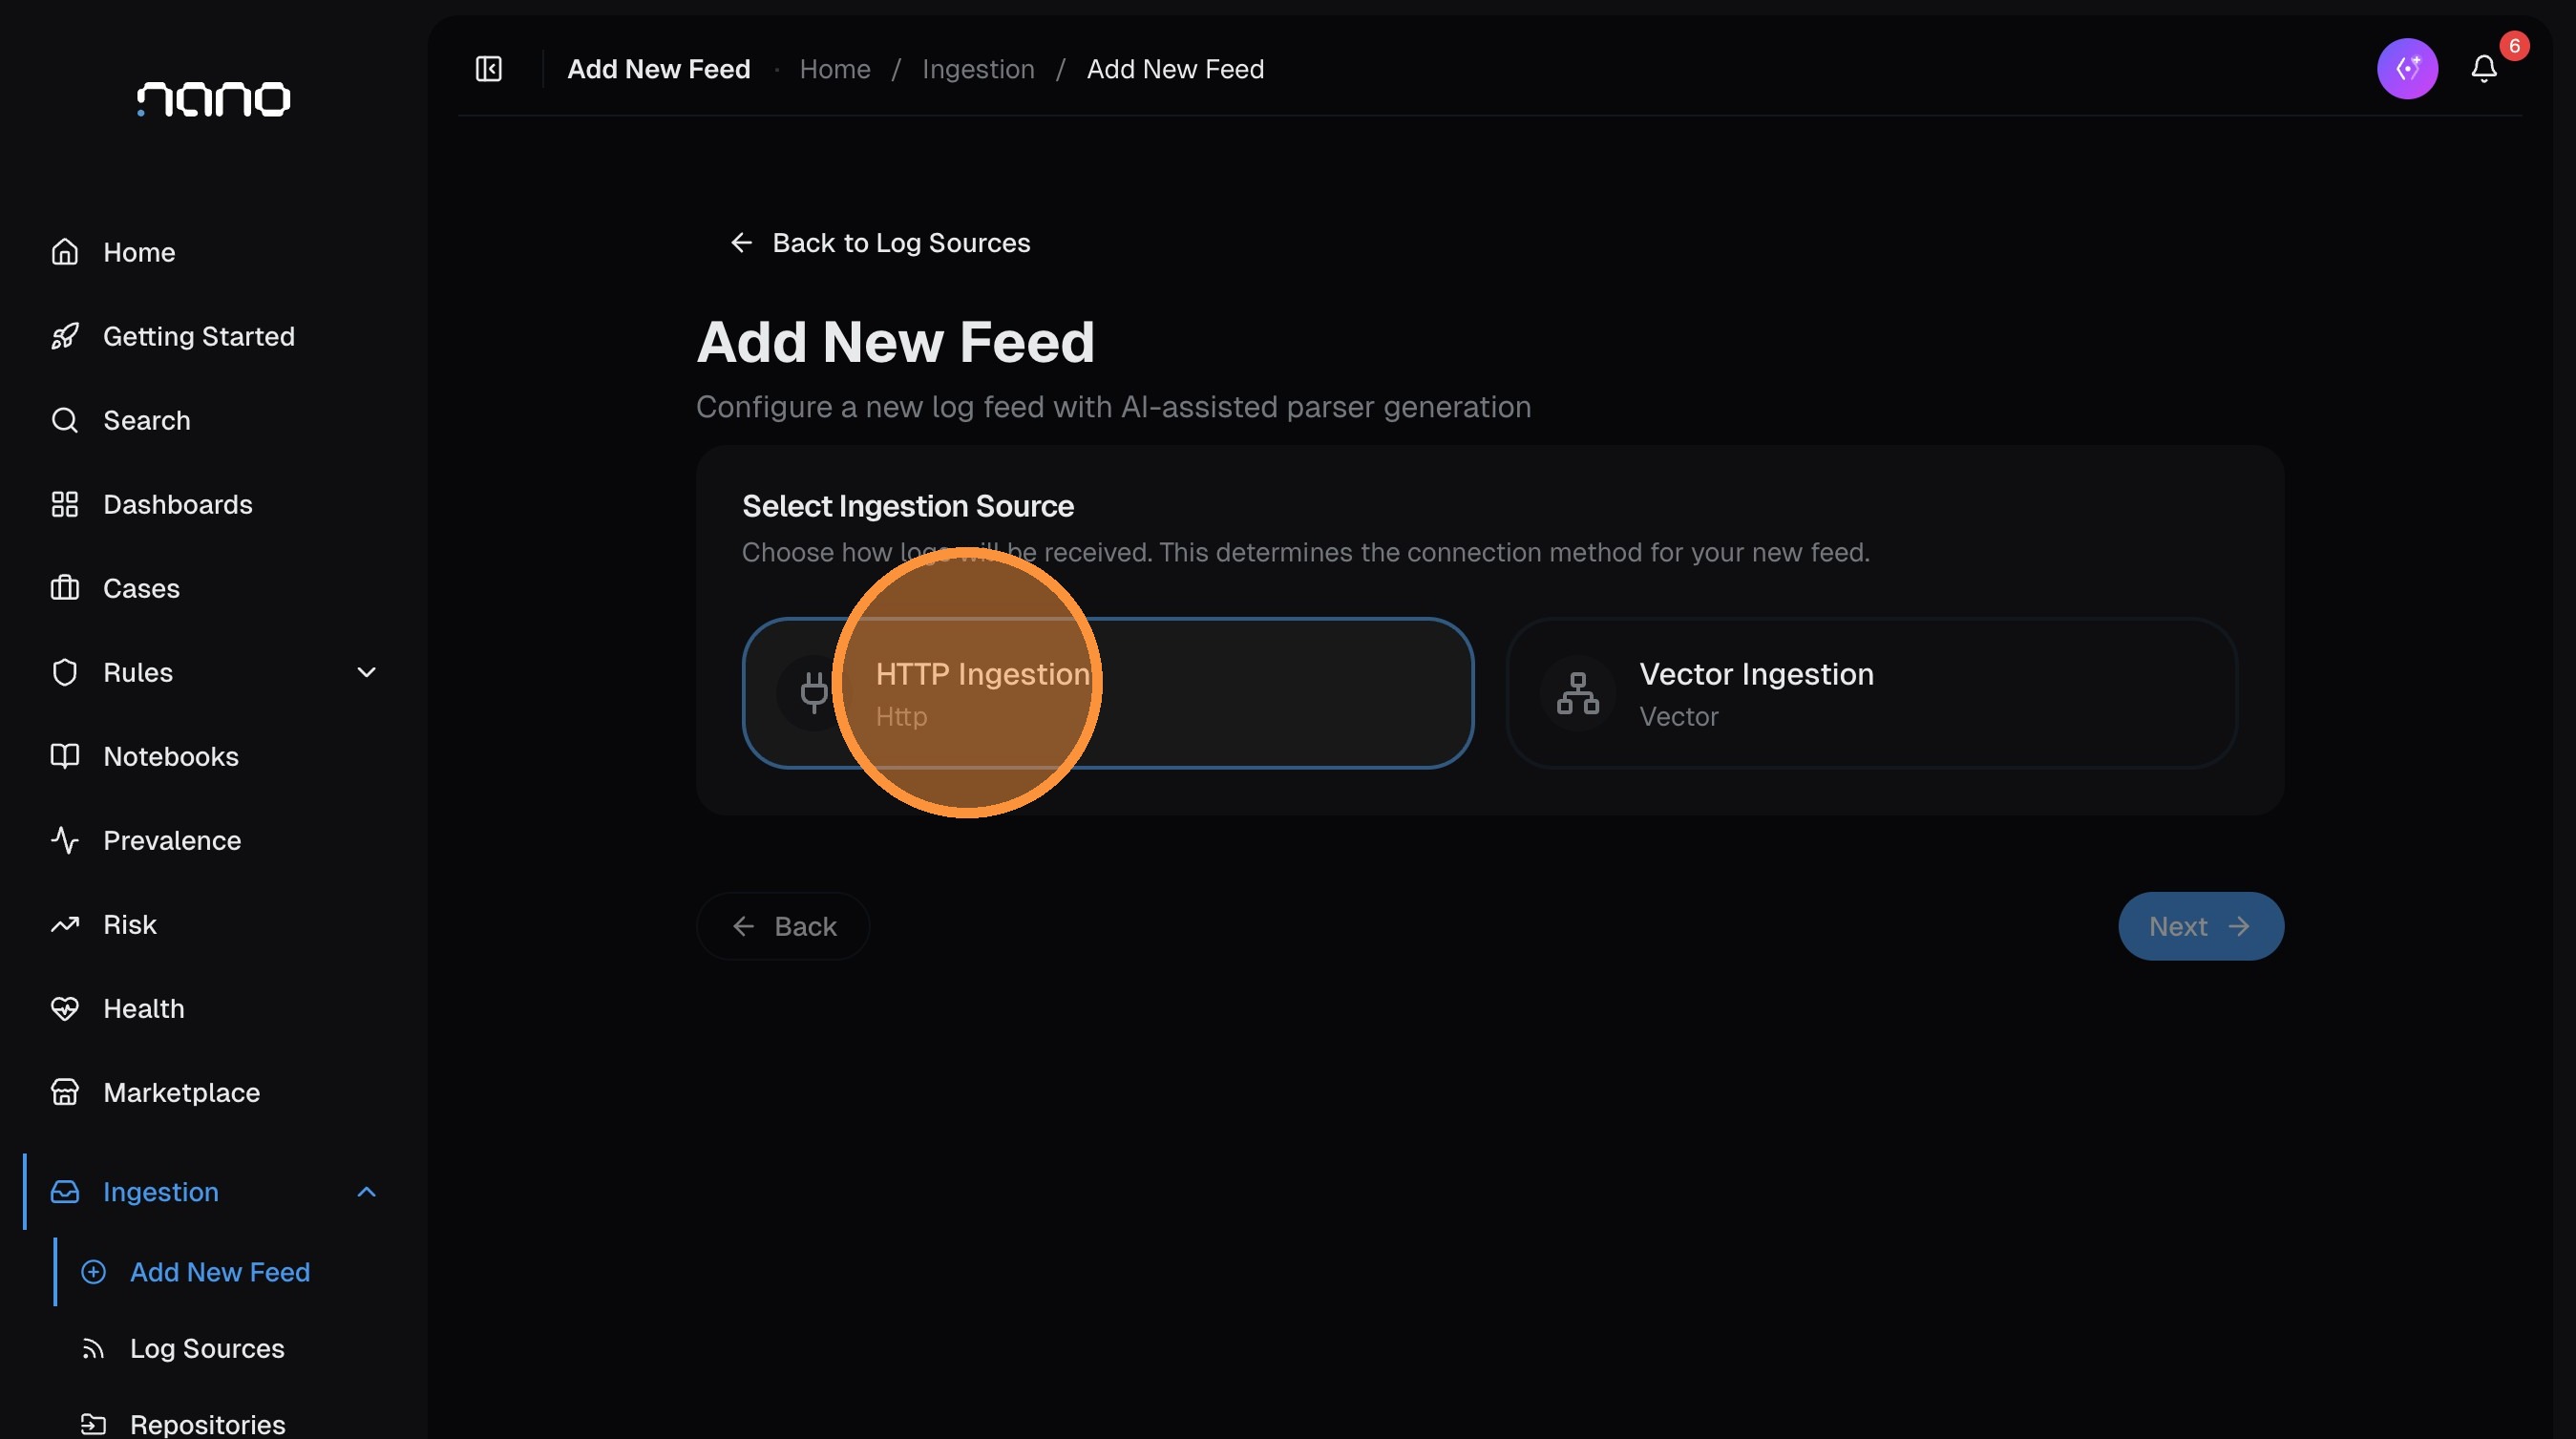
Click Next.
Name your feed
Enter a source type identifier — this is the value that routes incoming logs to this parser. Use lowercase with underscores (e.g., apache_access, custom_firewall, my_app).
This must match the X-Source-Type header your log shipper sends, or the source_type set by your Vector agent.
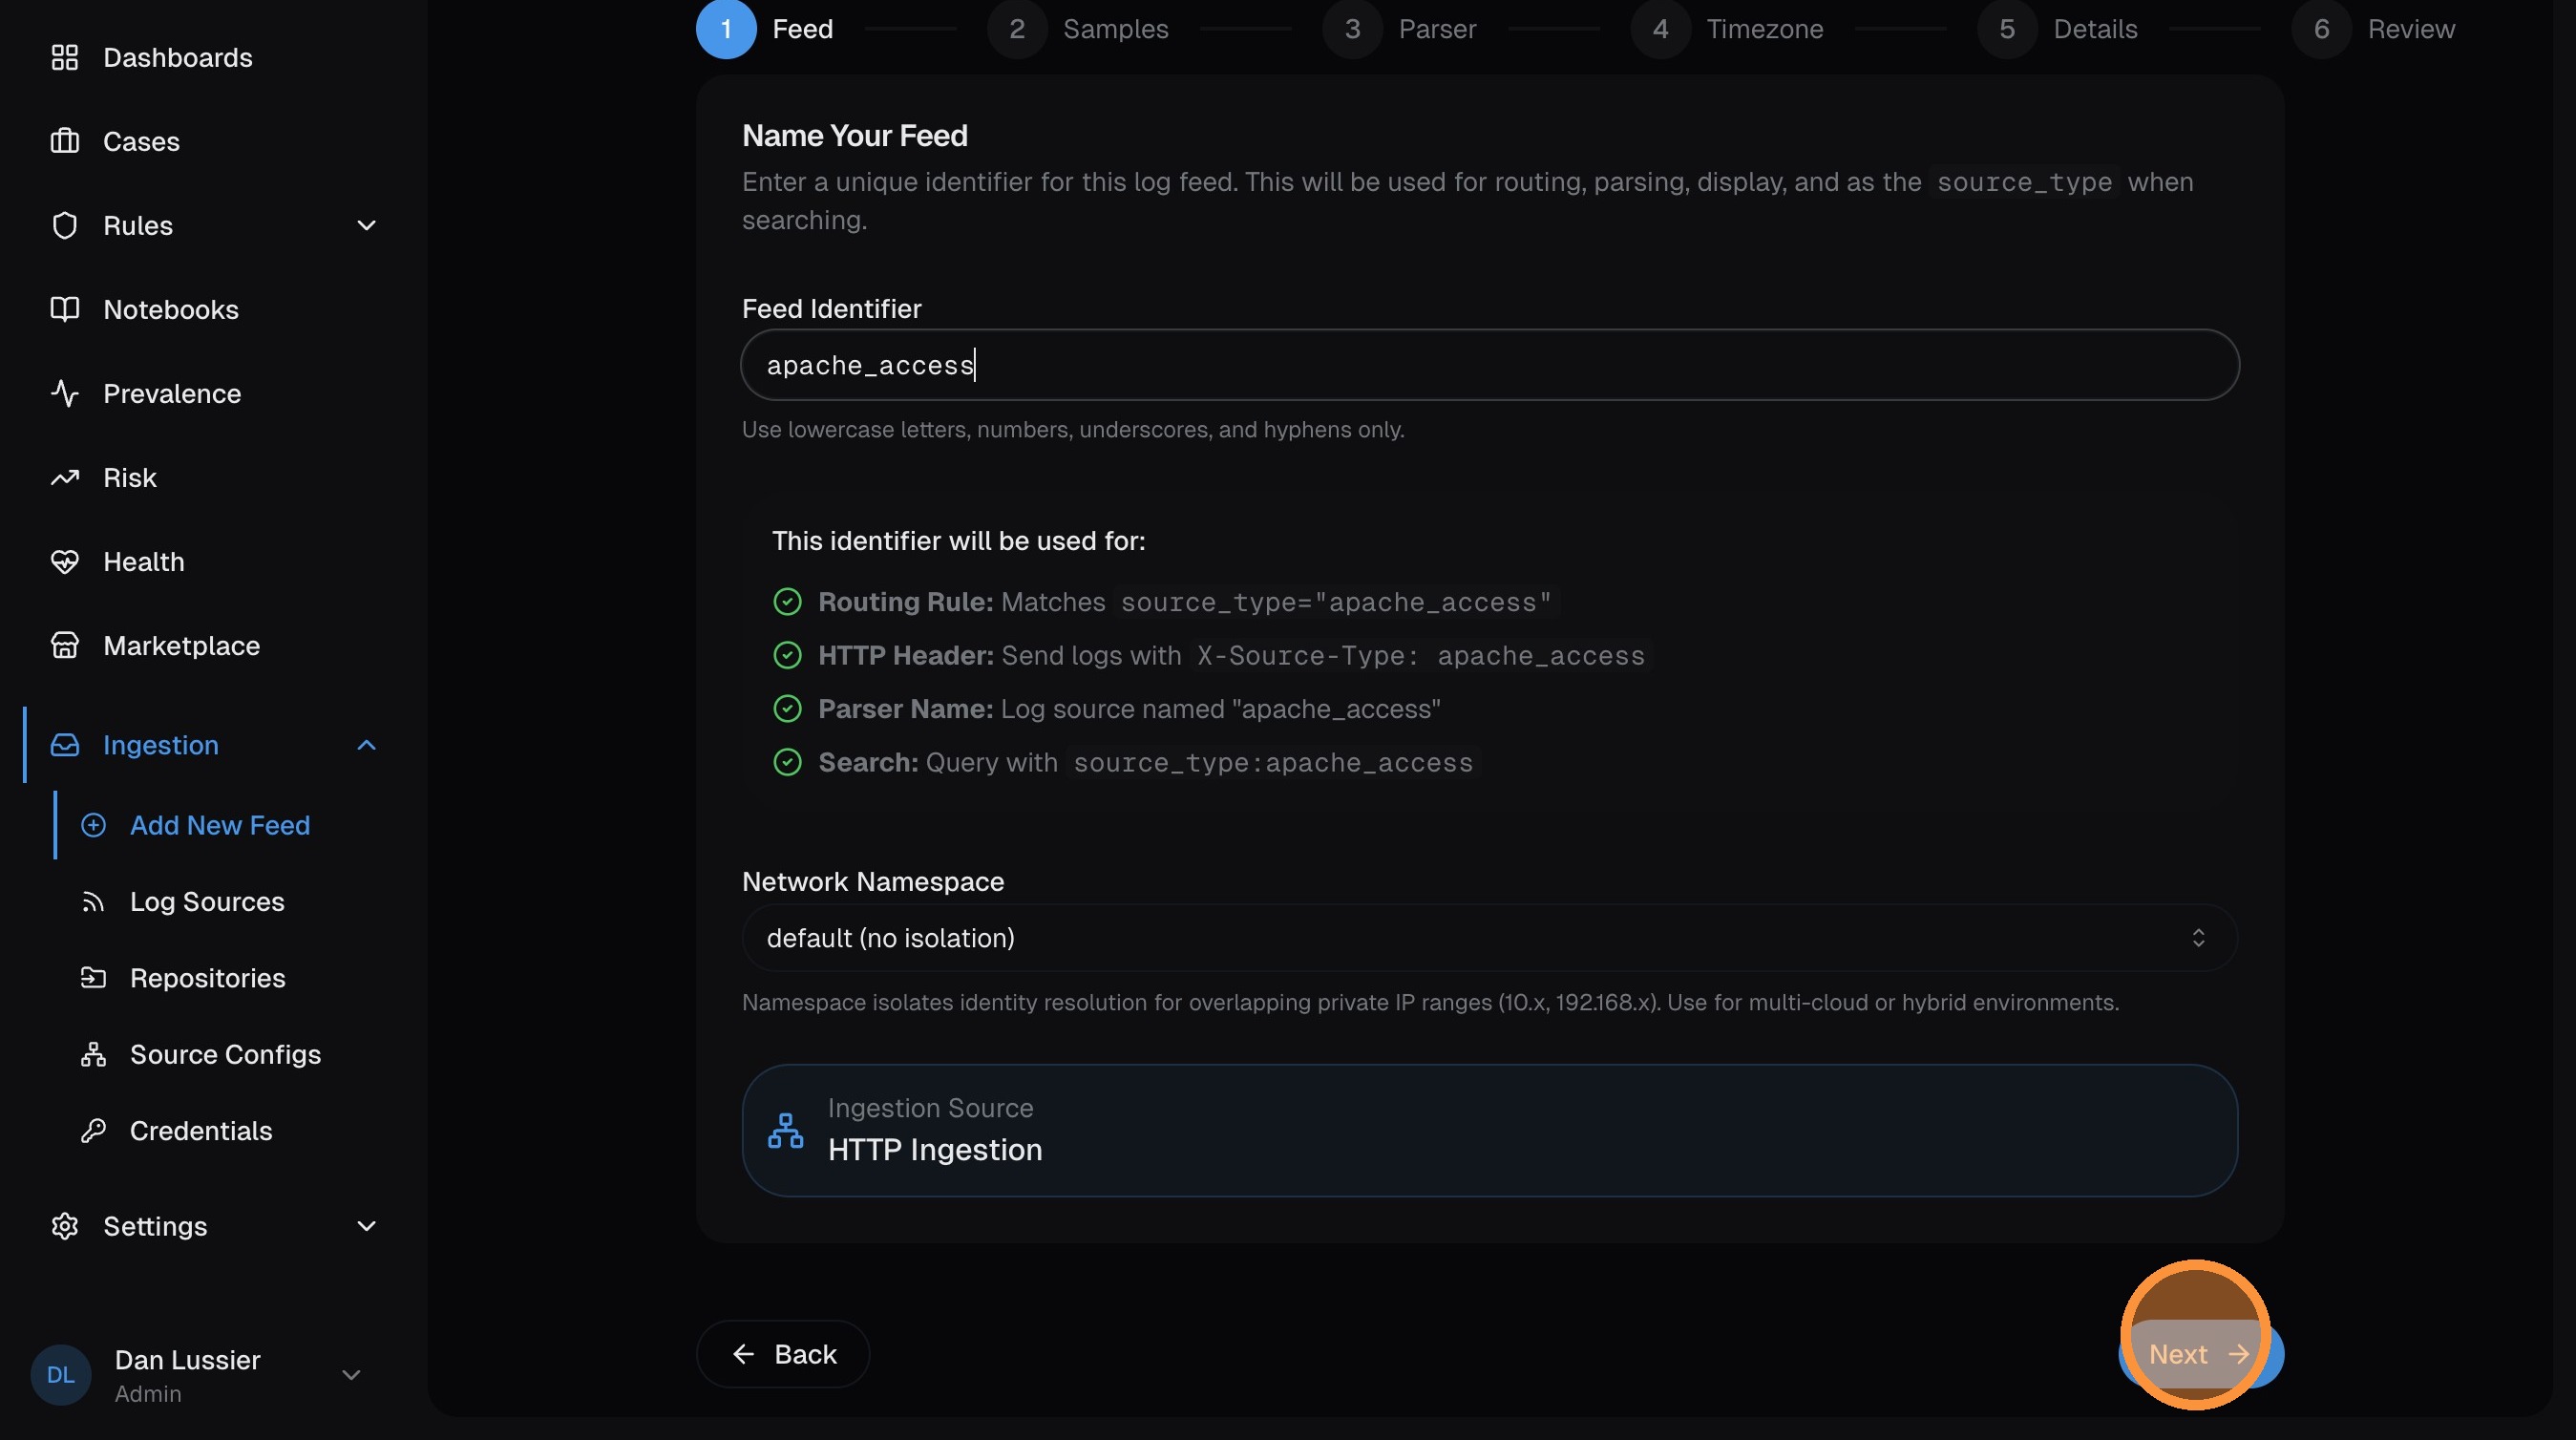
Click Next.
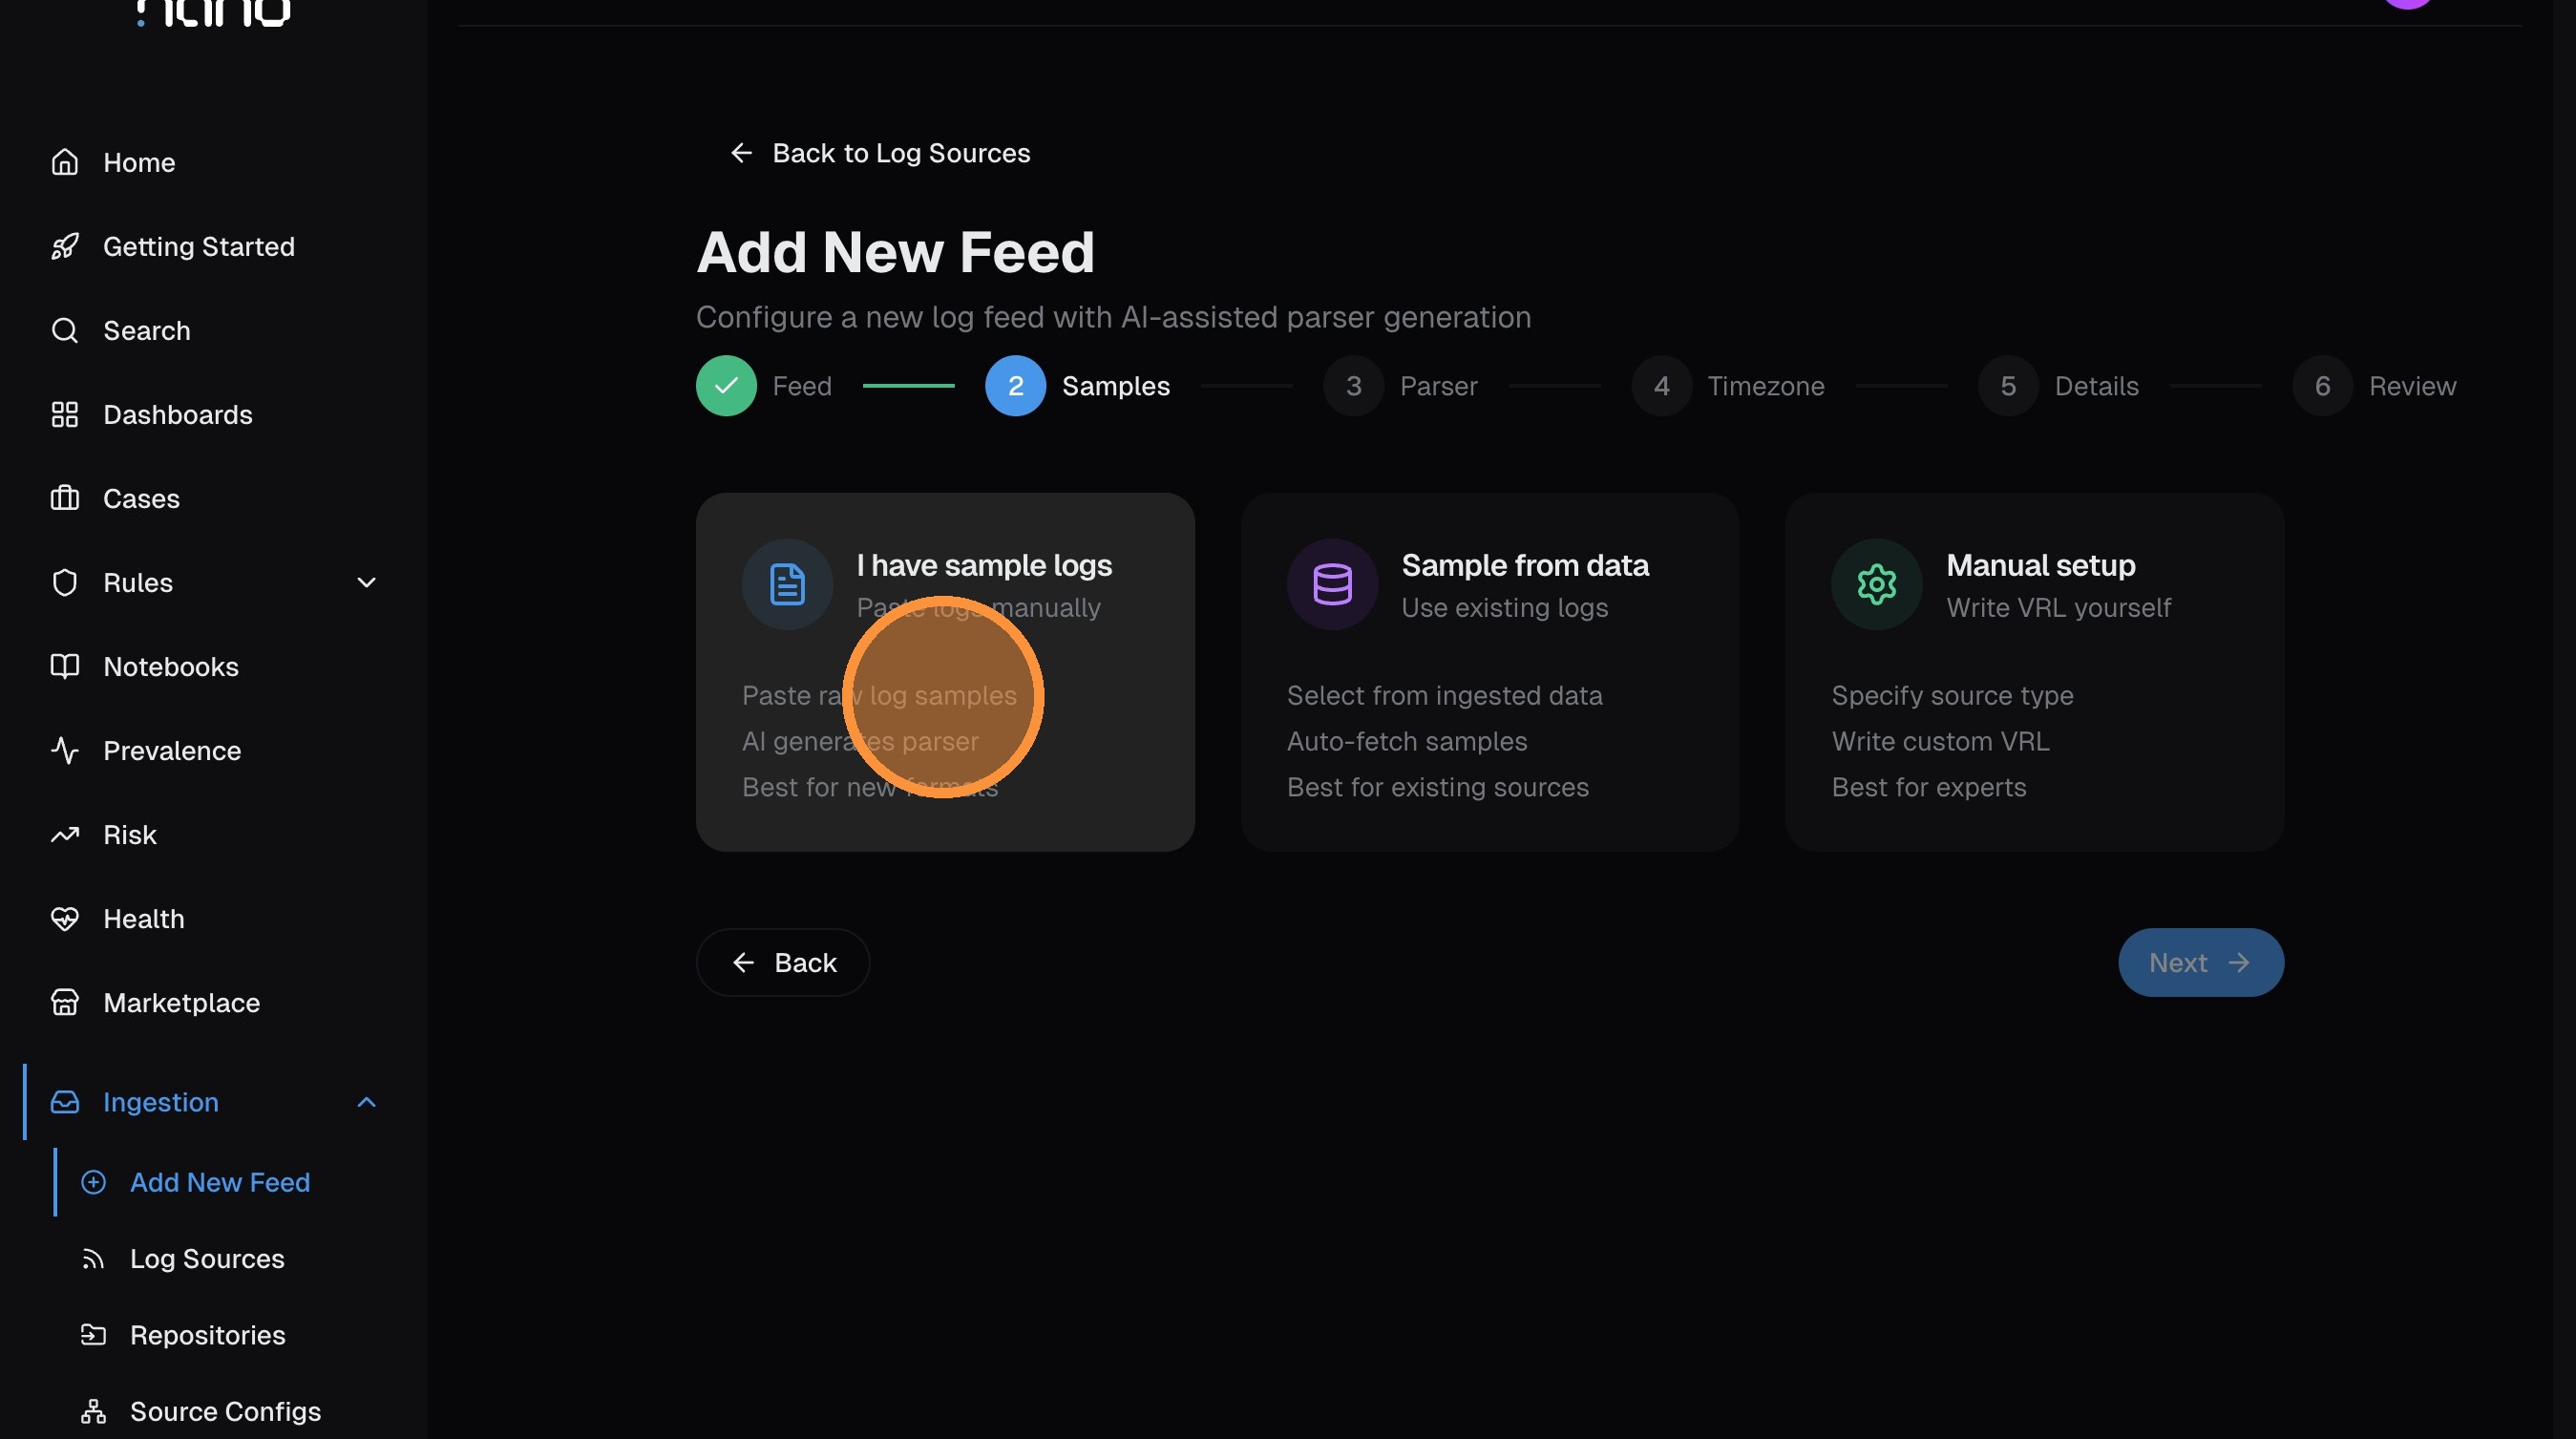
Choose your sample method
Select how you want to provide log samples for the AI to build a parser from:
- I have sample logs — paste raw log lines (most common for new sources)
- Sample from data — pull samples from logs already flowing into nano
- Manual setup — write VRL parser code yourself
Paste sample logs
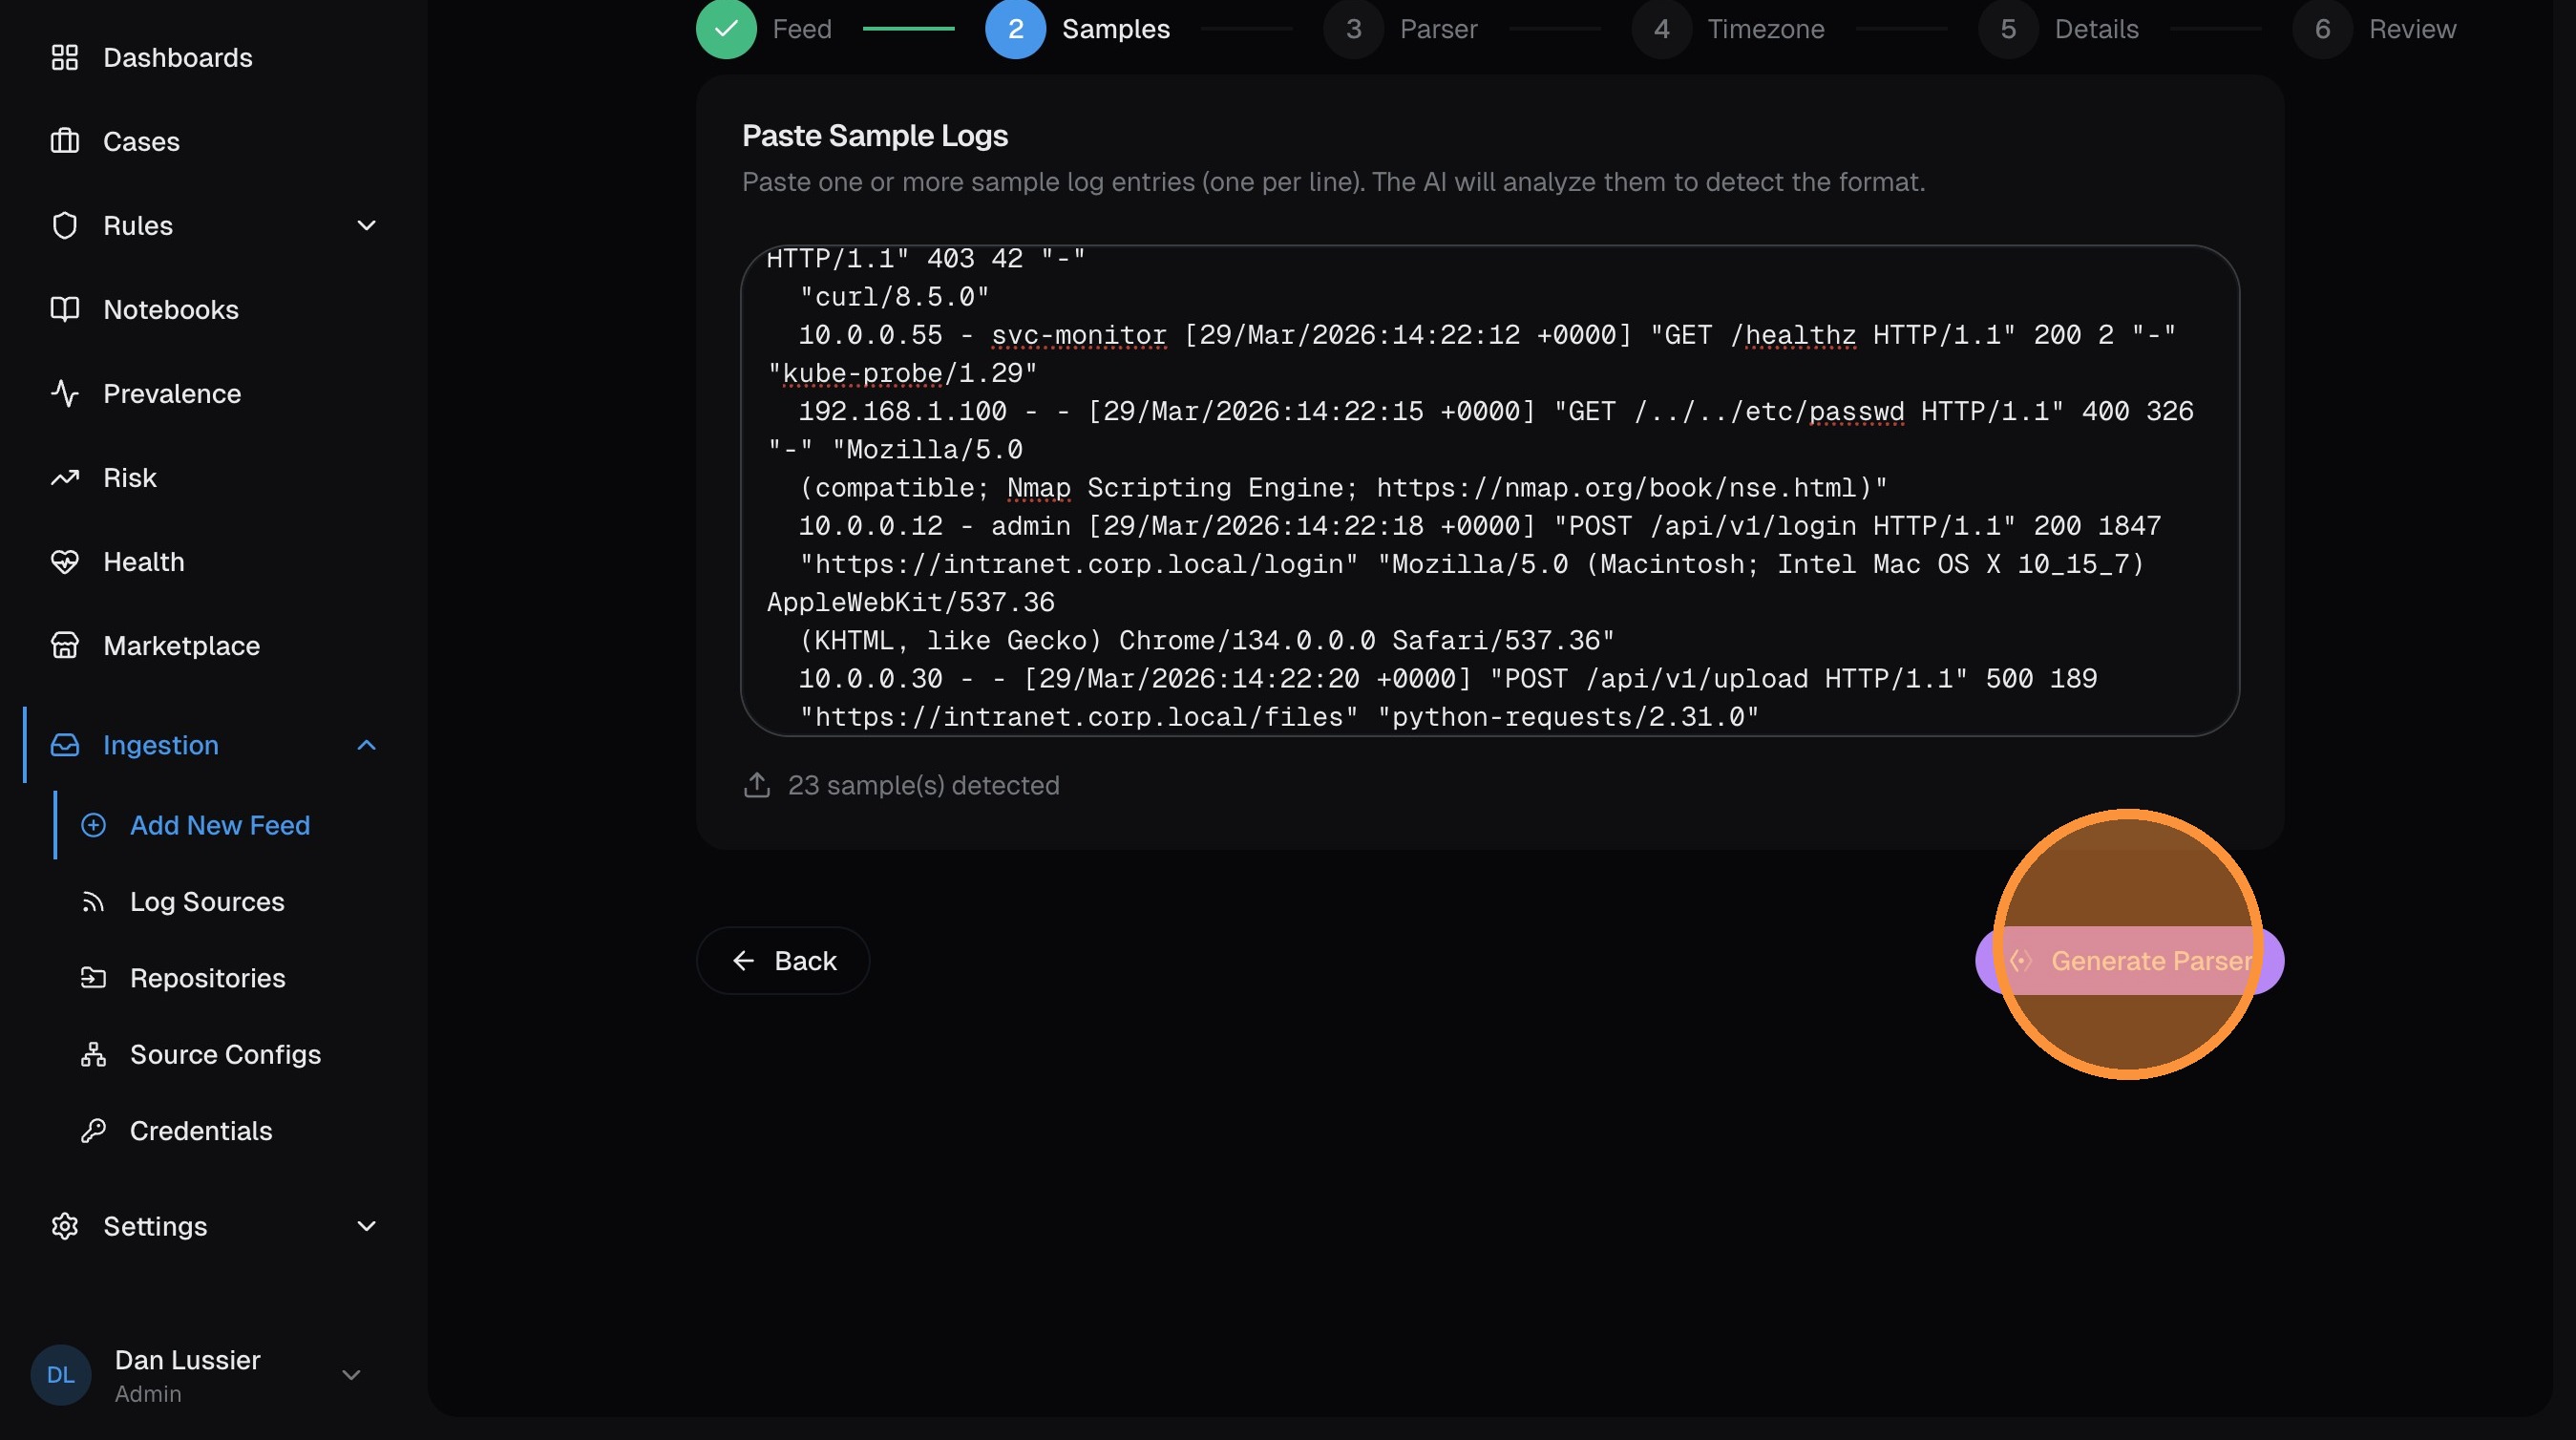
Paste 5-10 representative log lines into the text area. Include different event types for the best parser coverage.
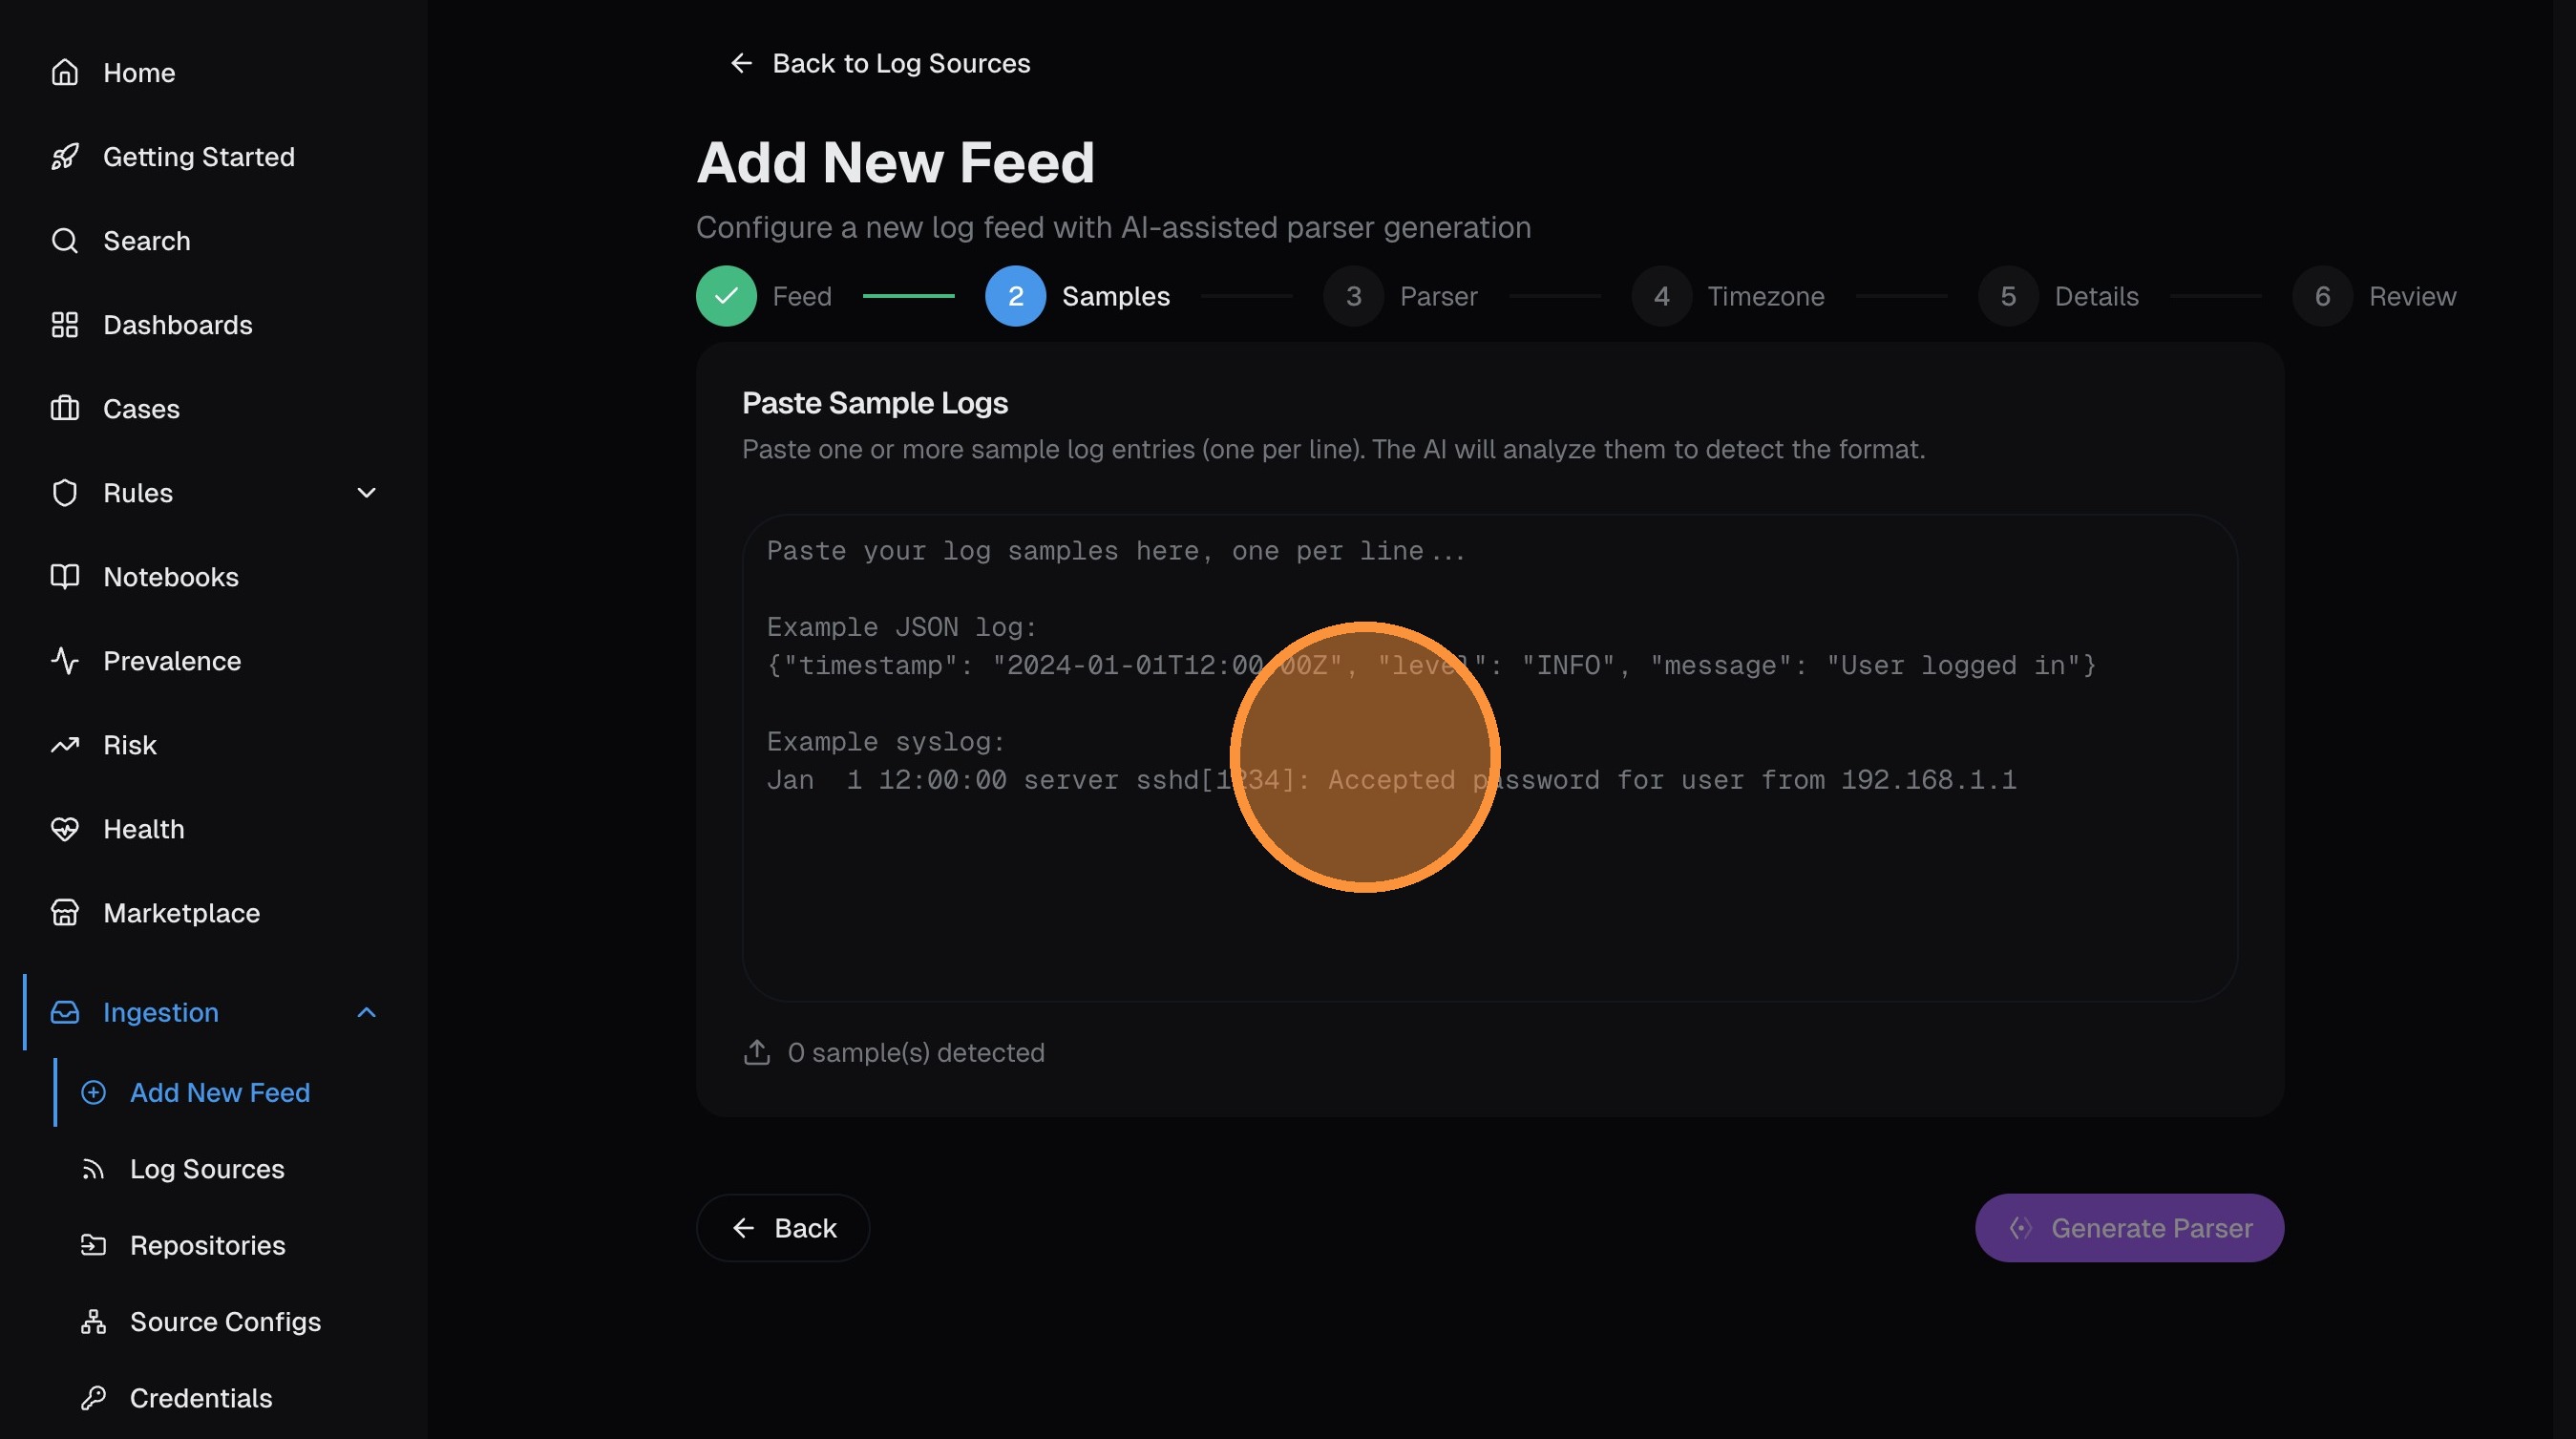
Click Generate Parser — the AI analyzes your samples and writes VRL code that extracts structured fields.
Review the generated parser
The AI produces VRL code that maps your raw logs into UDM fields — IP addresses, usernames, HTTP methods, status codes, etc. Review the code and click Next when satisfied.
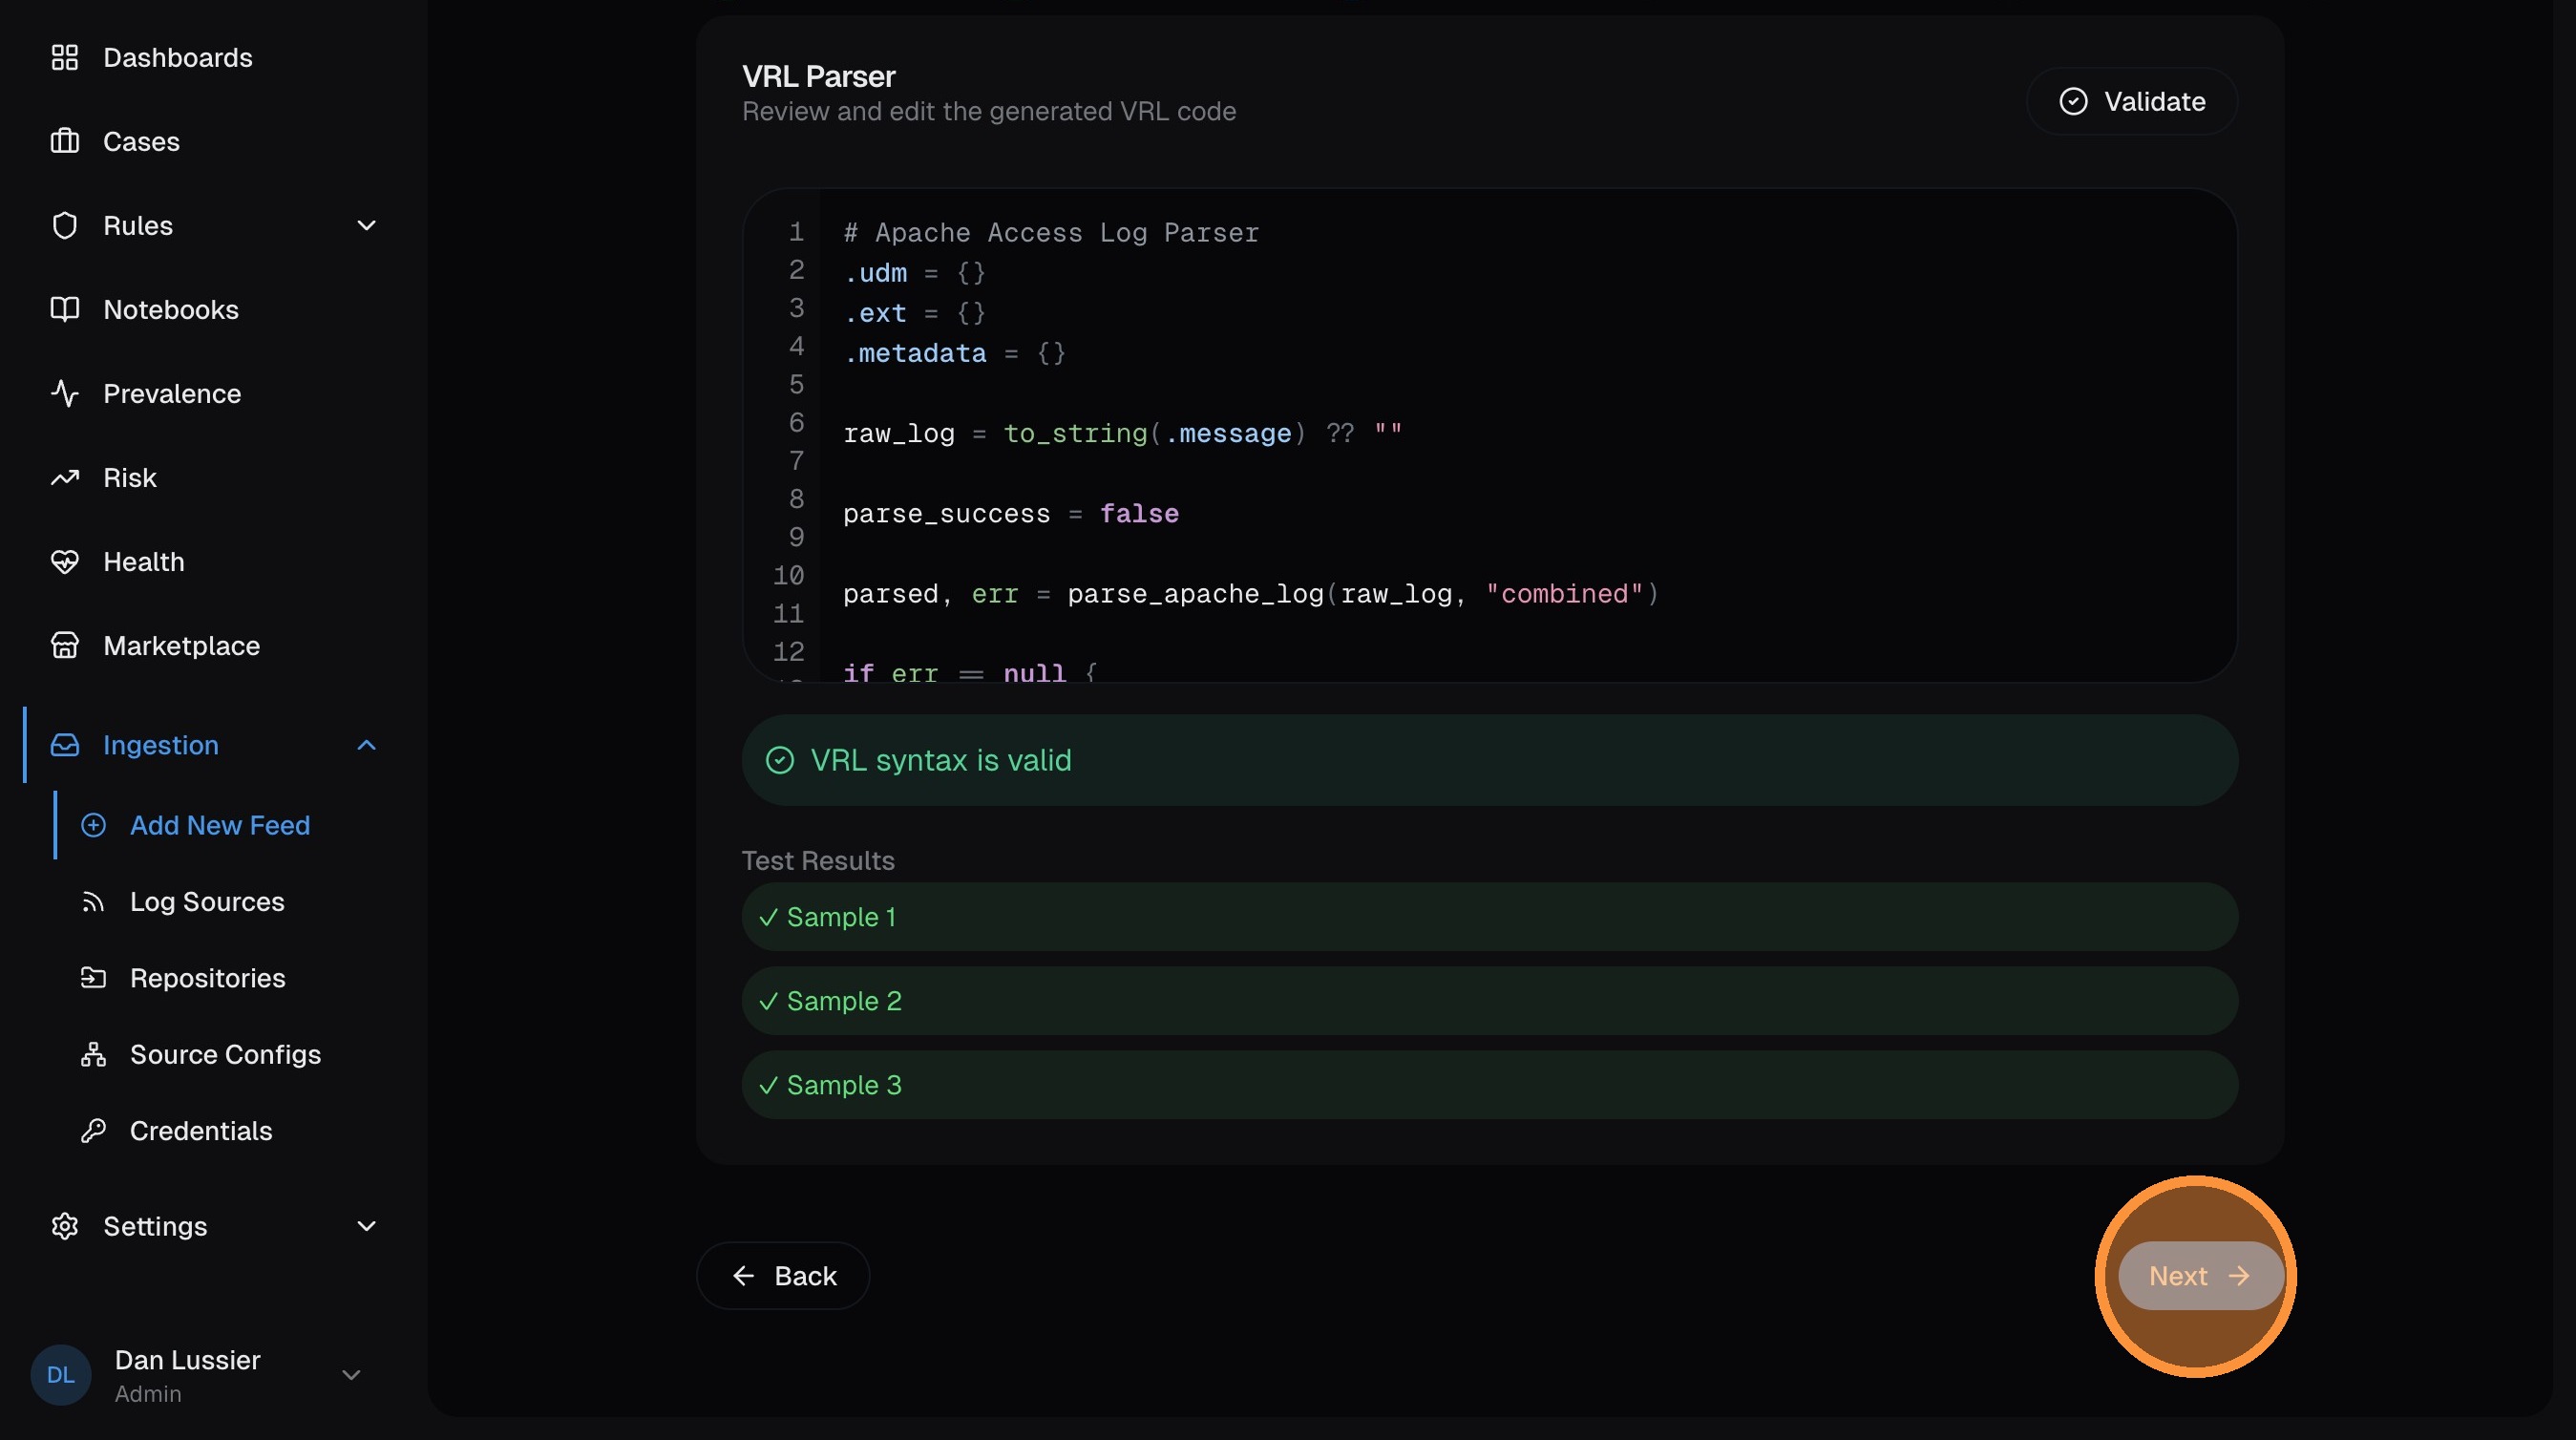
The AI parser generator works best with diverse samples. Include different event types, edge cases, and both normal and error conditions for the most accurate parser.
Set timezone
If your logs send timestamps without a timezone offset, select the source's timezone here so nano can convert to UTC. If timestamps already include timezone info (ISO 8601 with offset, or Z suffix), leave this as UTC.
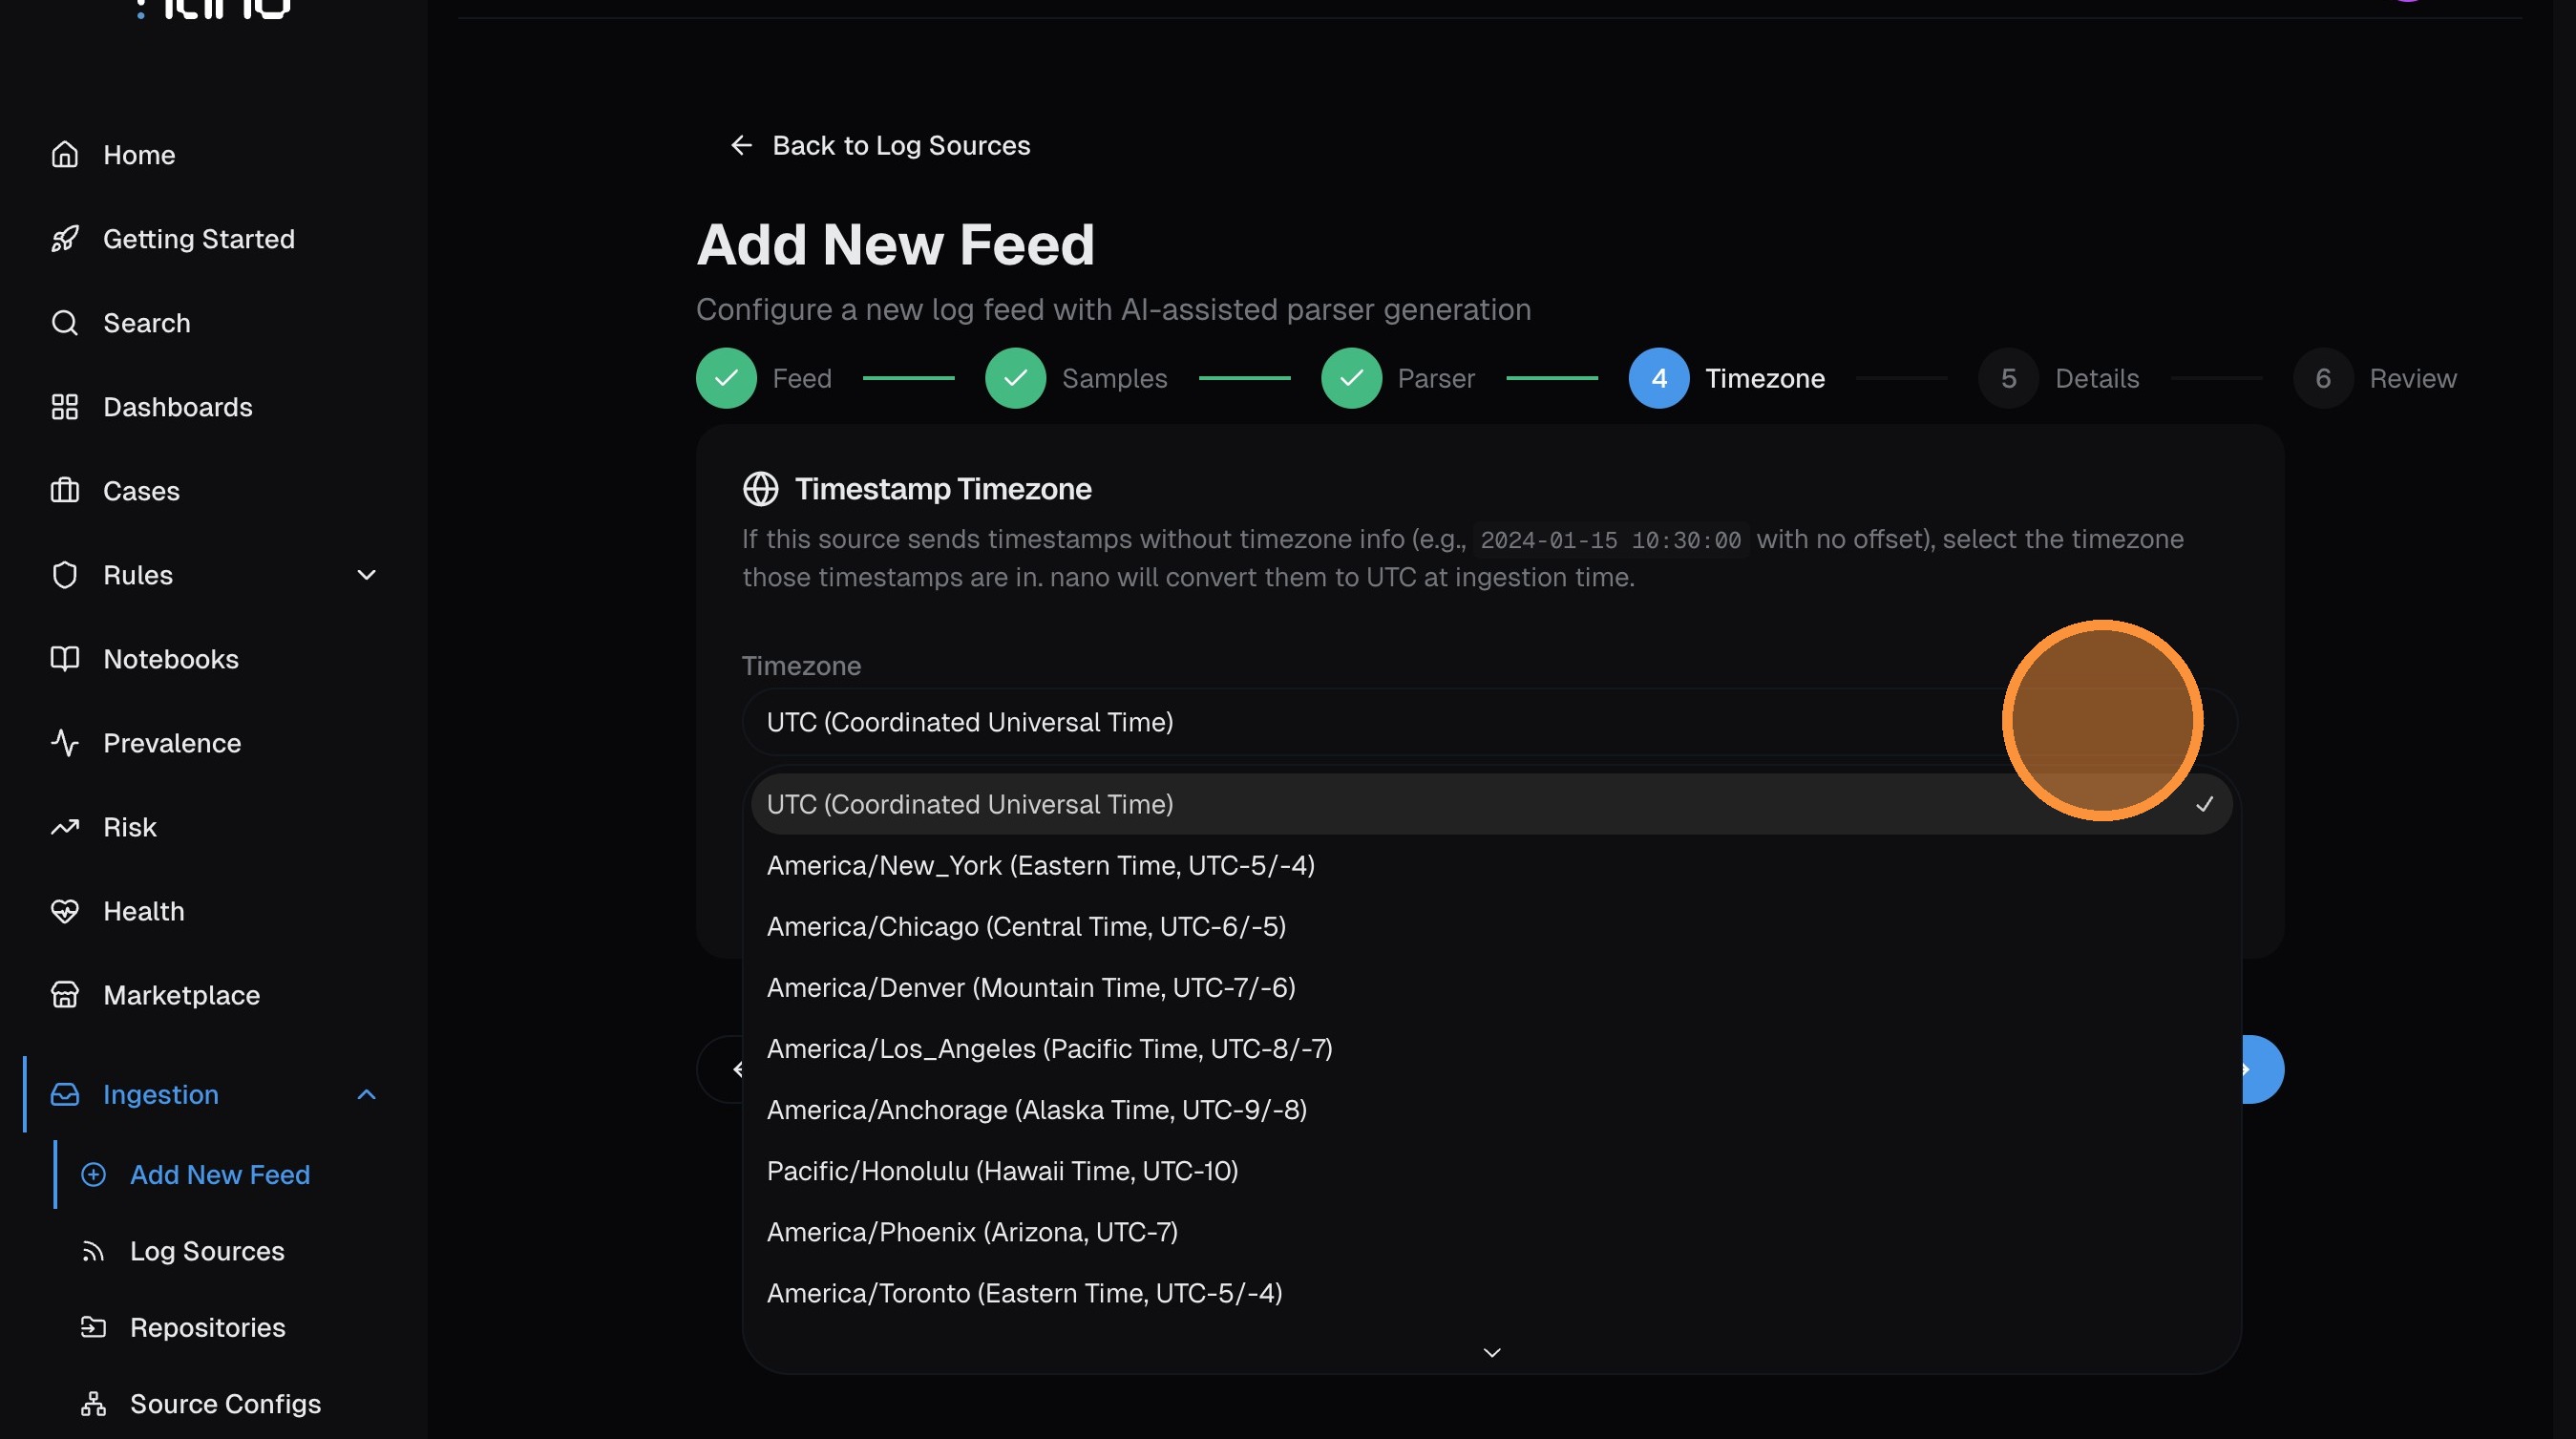
Click Next.
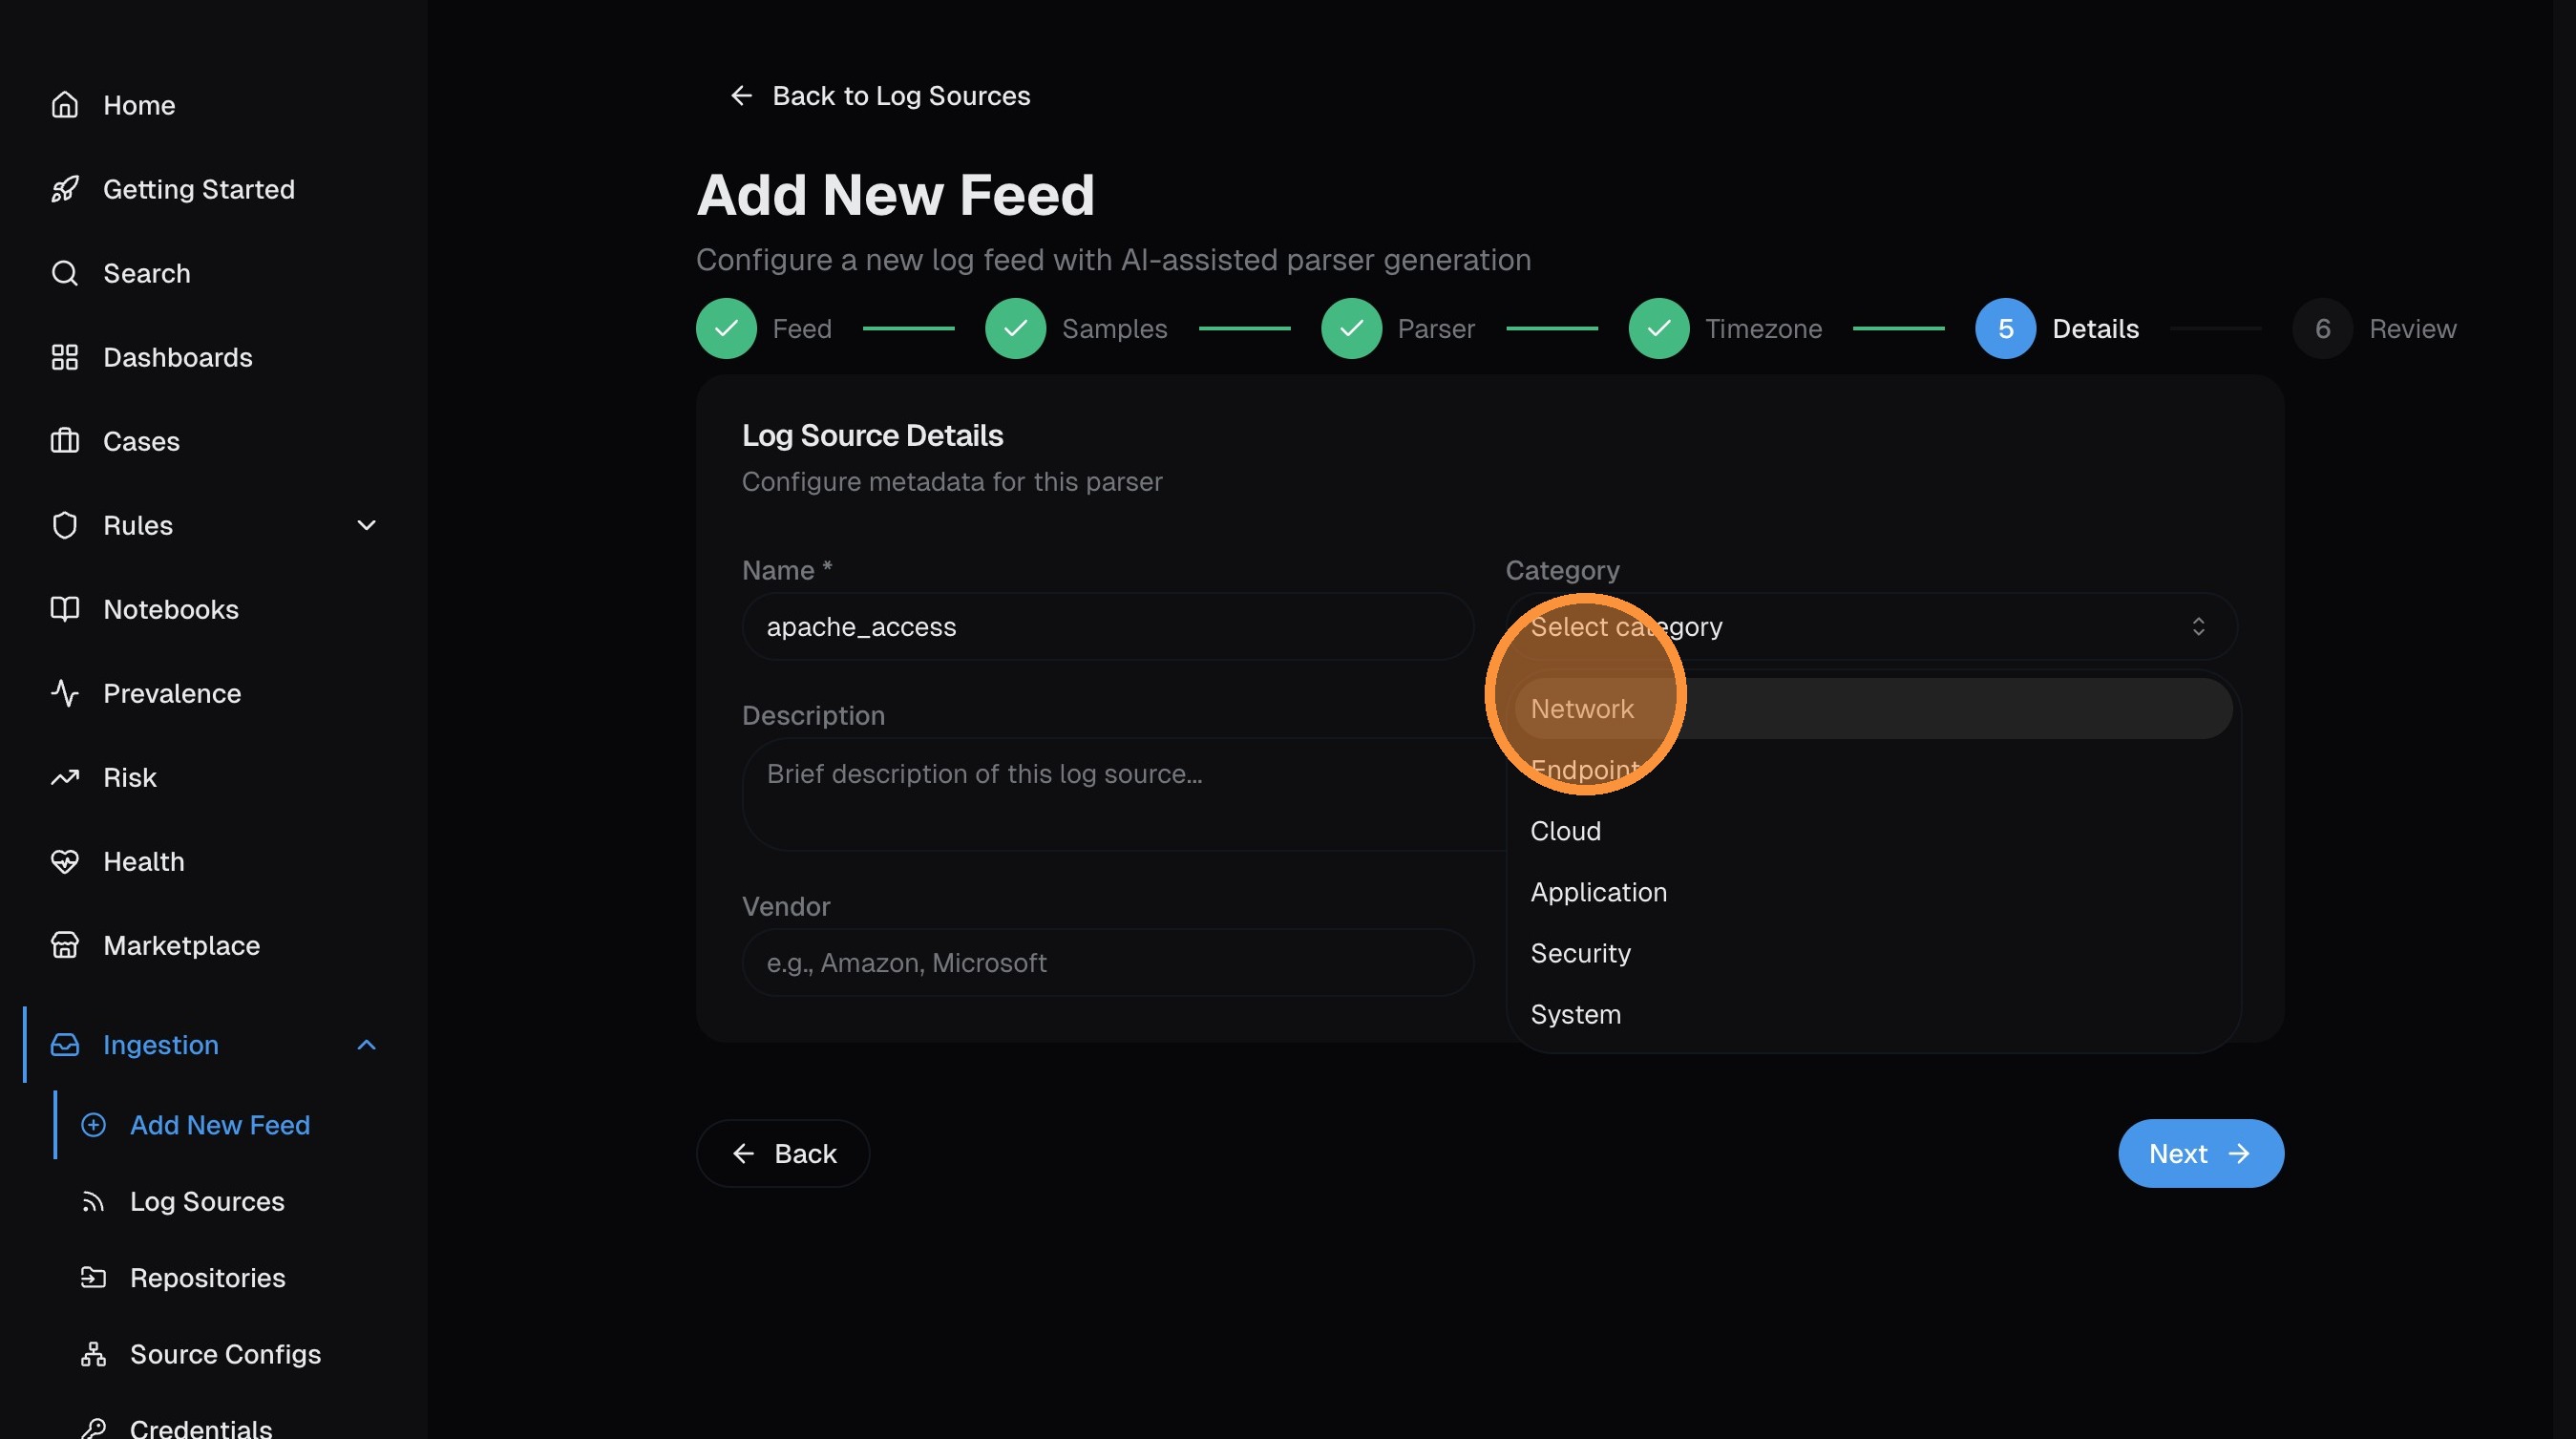
Add metadata
Categorize the log source so nano can organize it in the UI and give the AI better context:
- Category — network, endpoint, cloud, application, security, or system
- Description — brief summary of what this source is
- Vendor — the company that produces the logs (e.g., Apache Software Foundation)
- Product — the specific product (e.g., Apache HTTP Server)
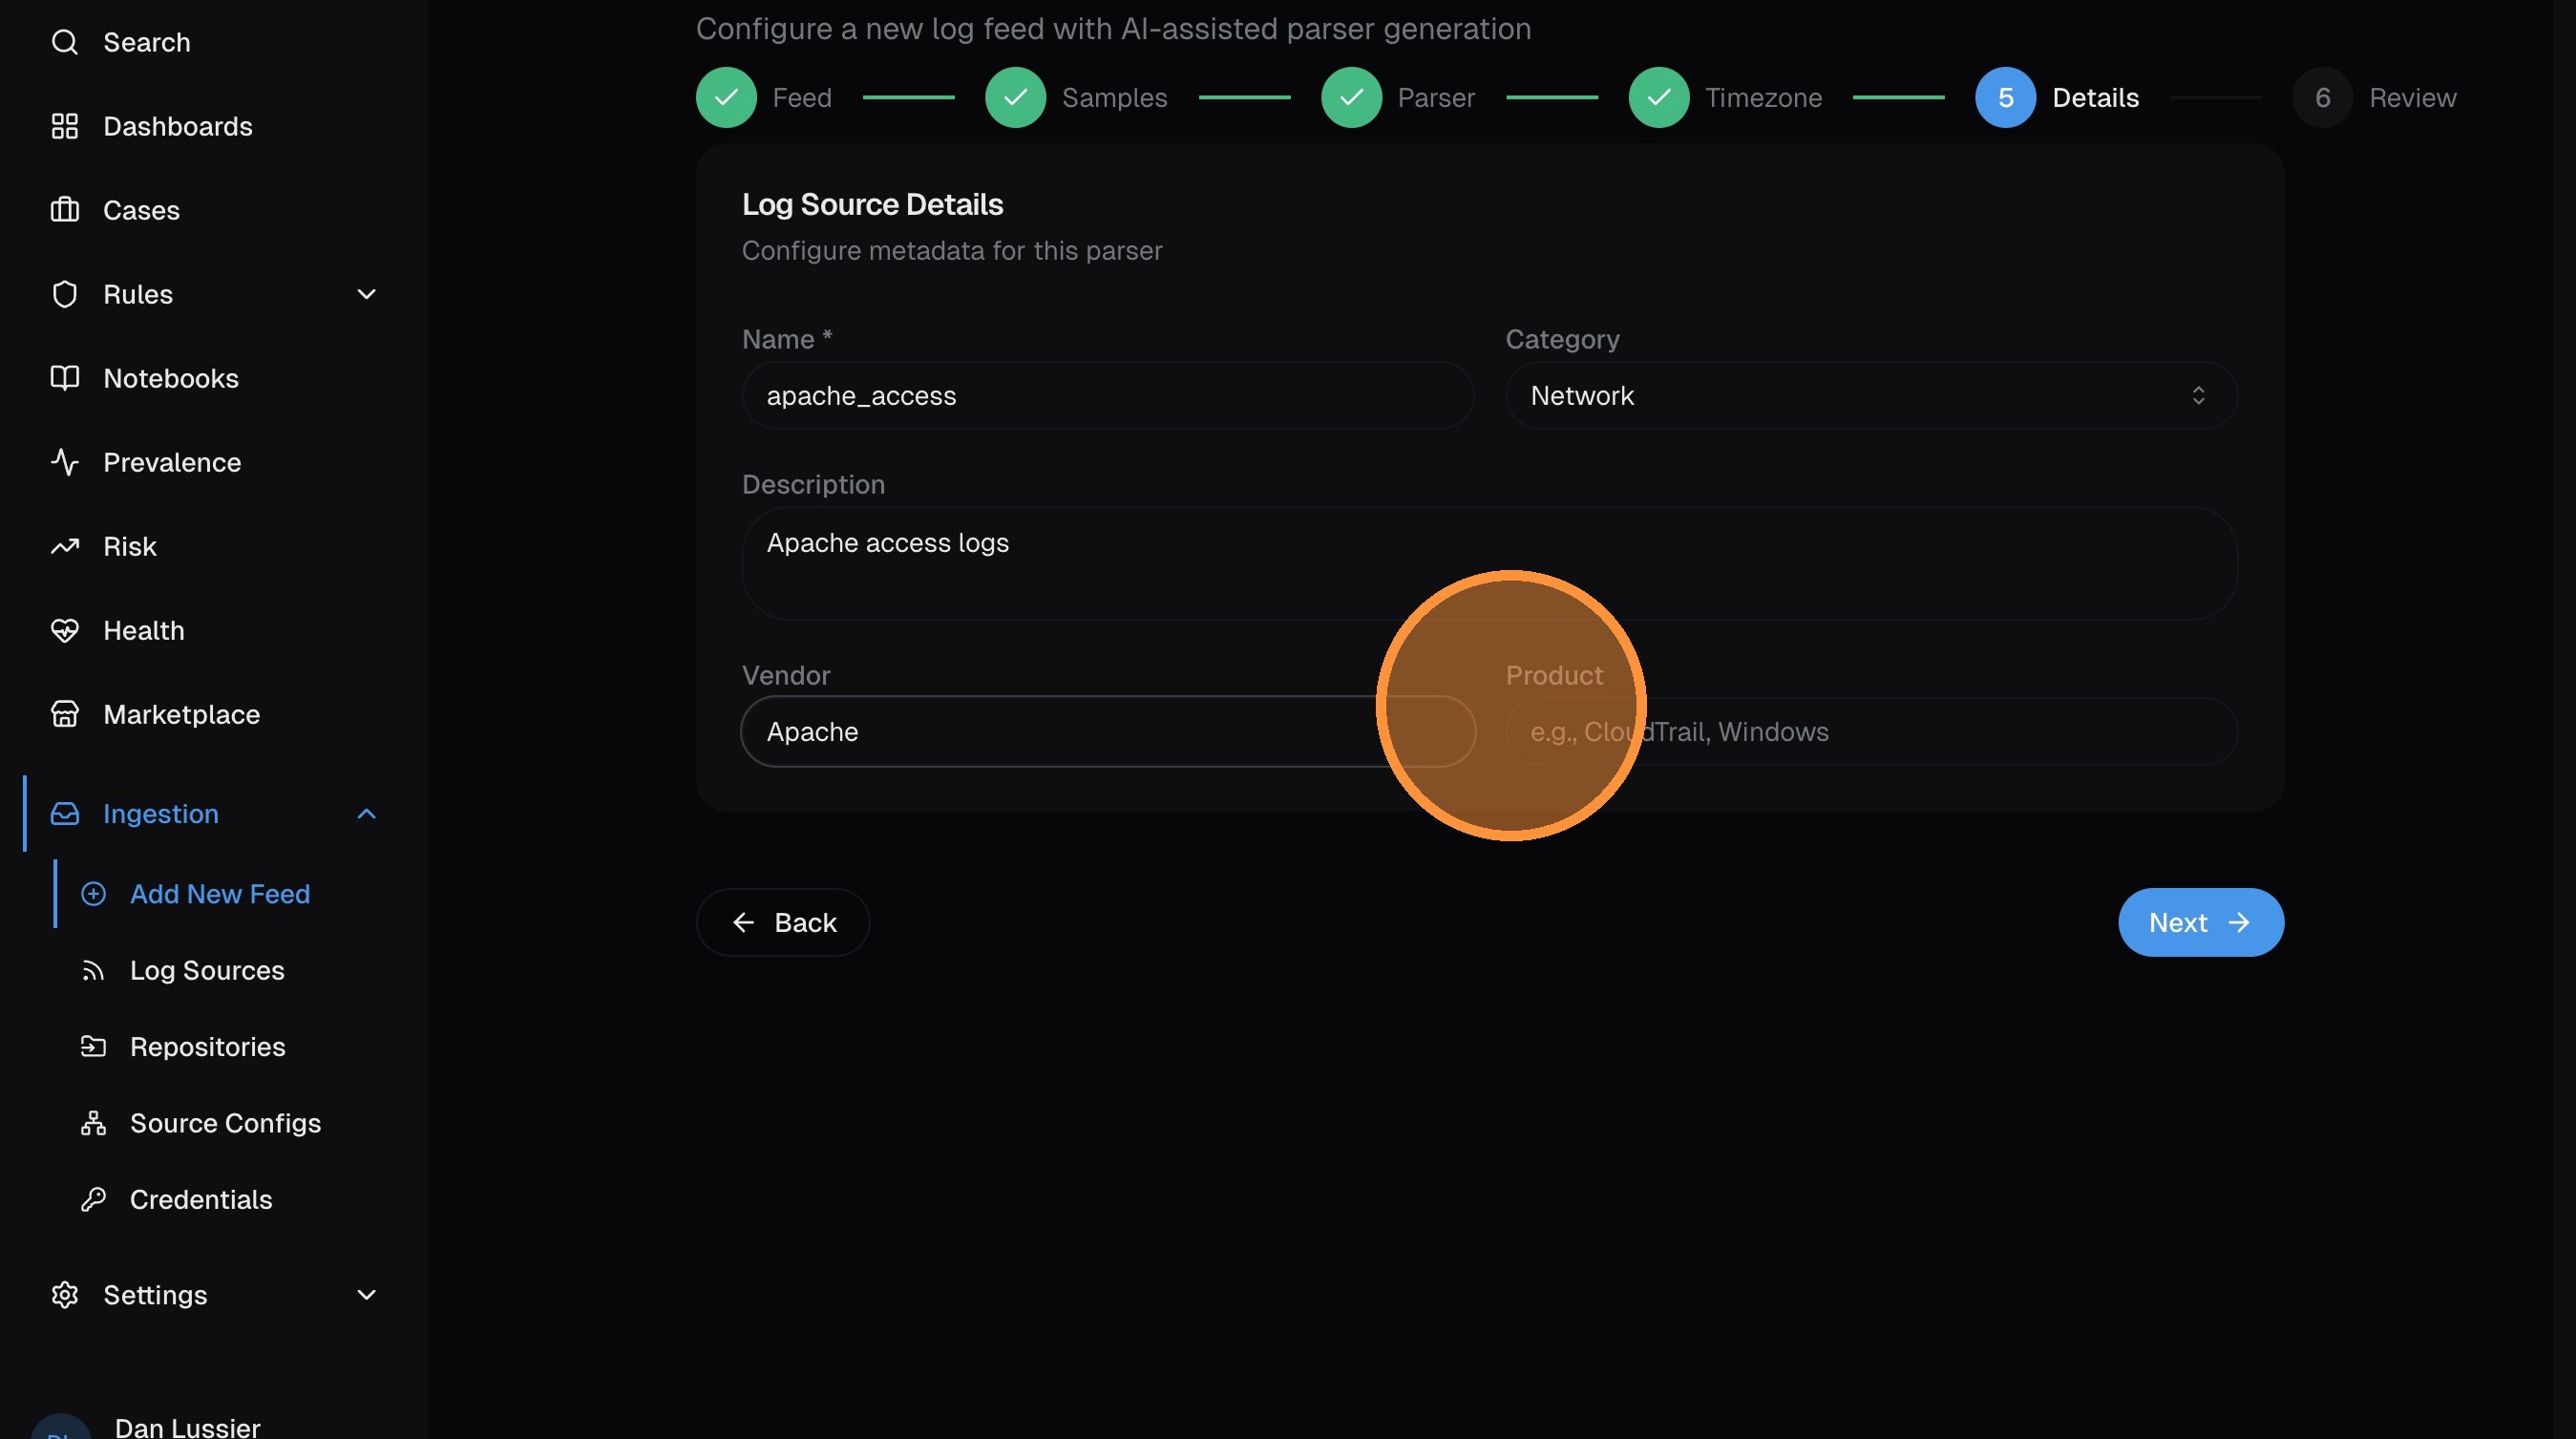
Click Next.
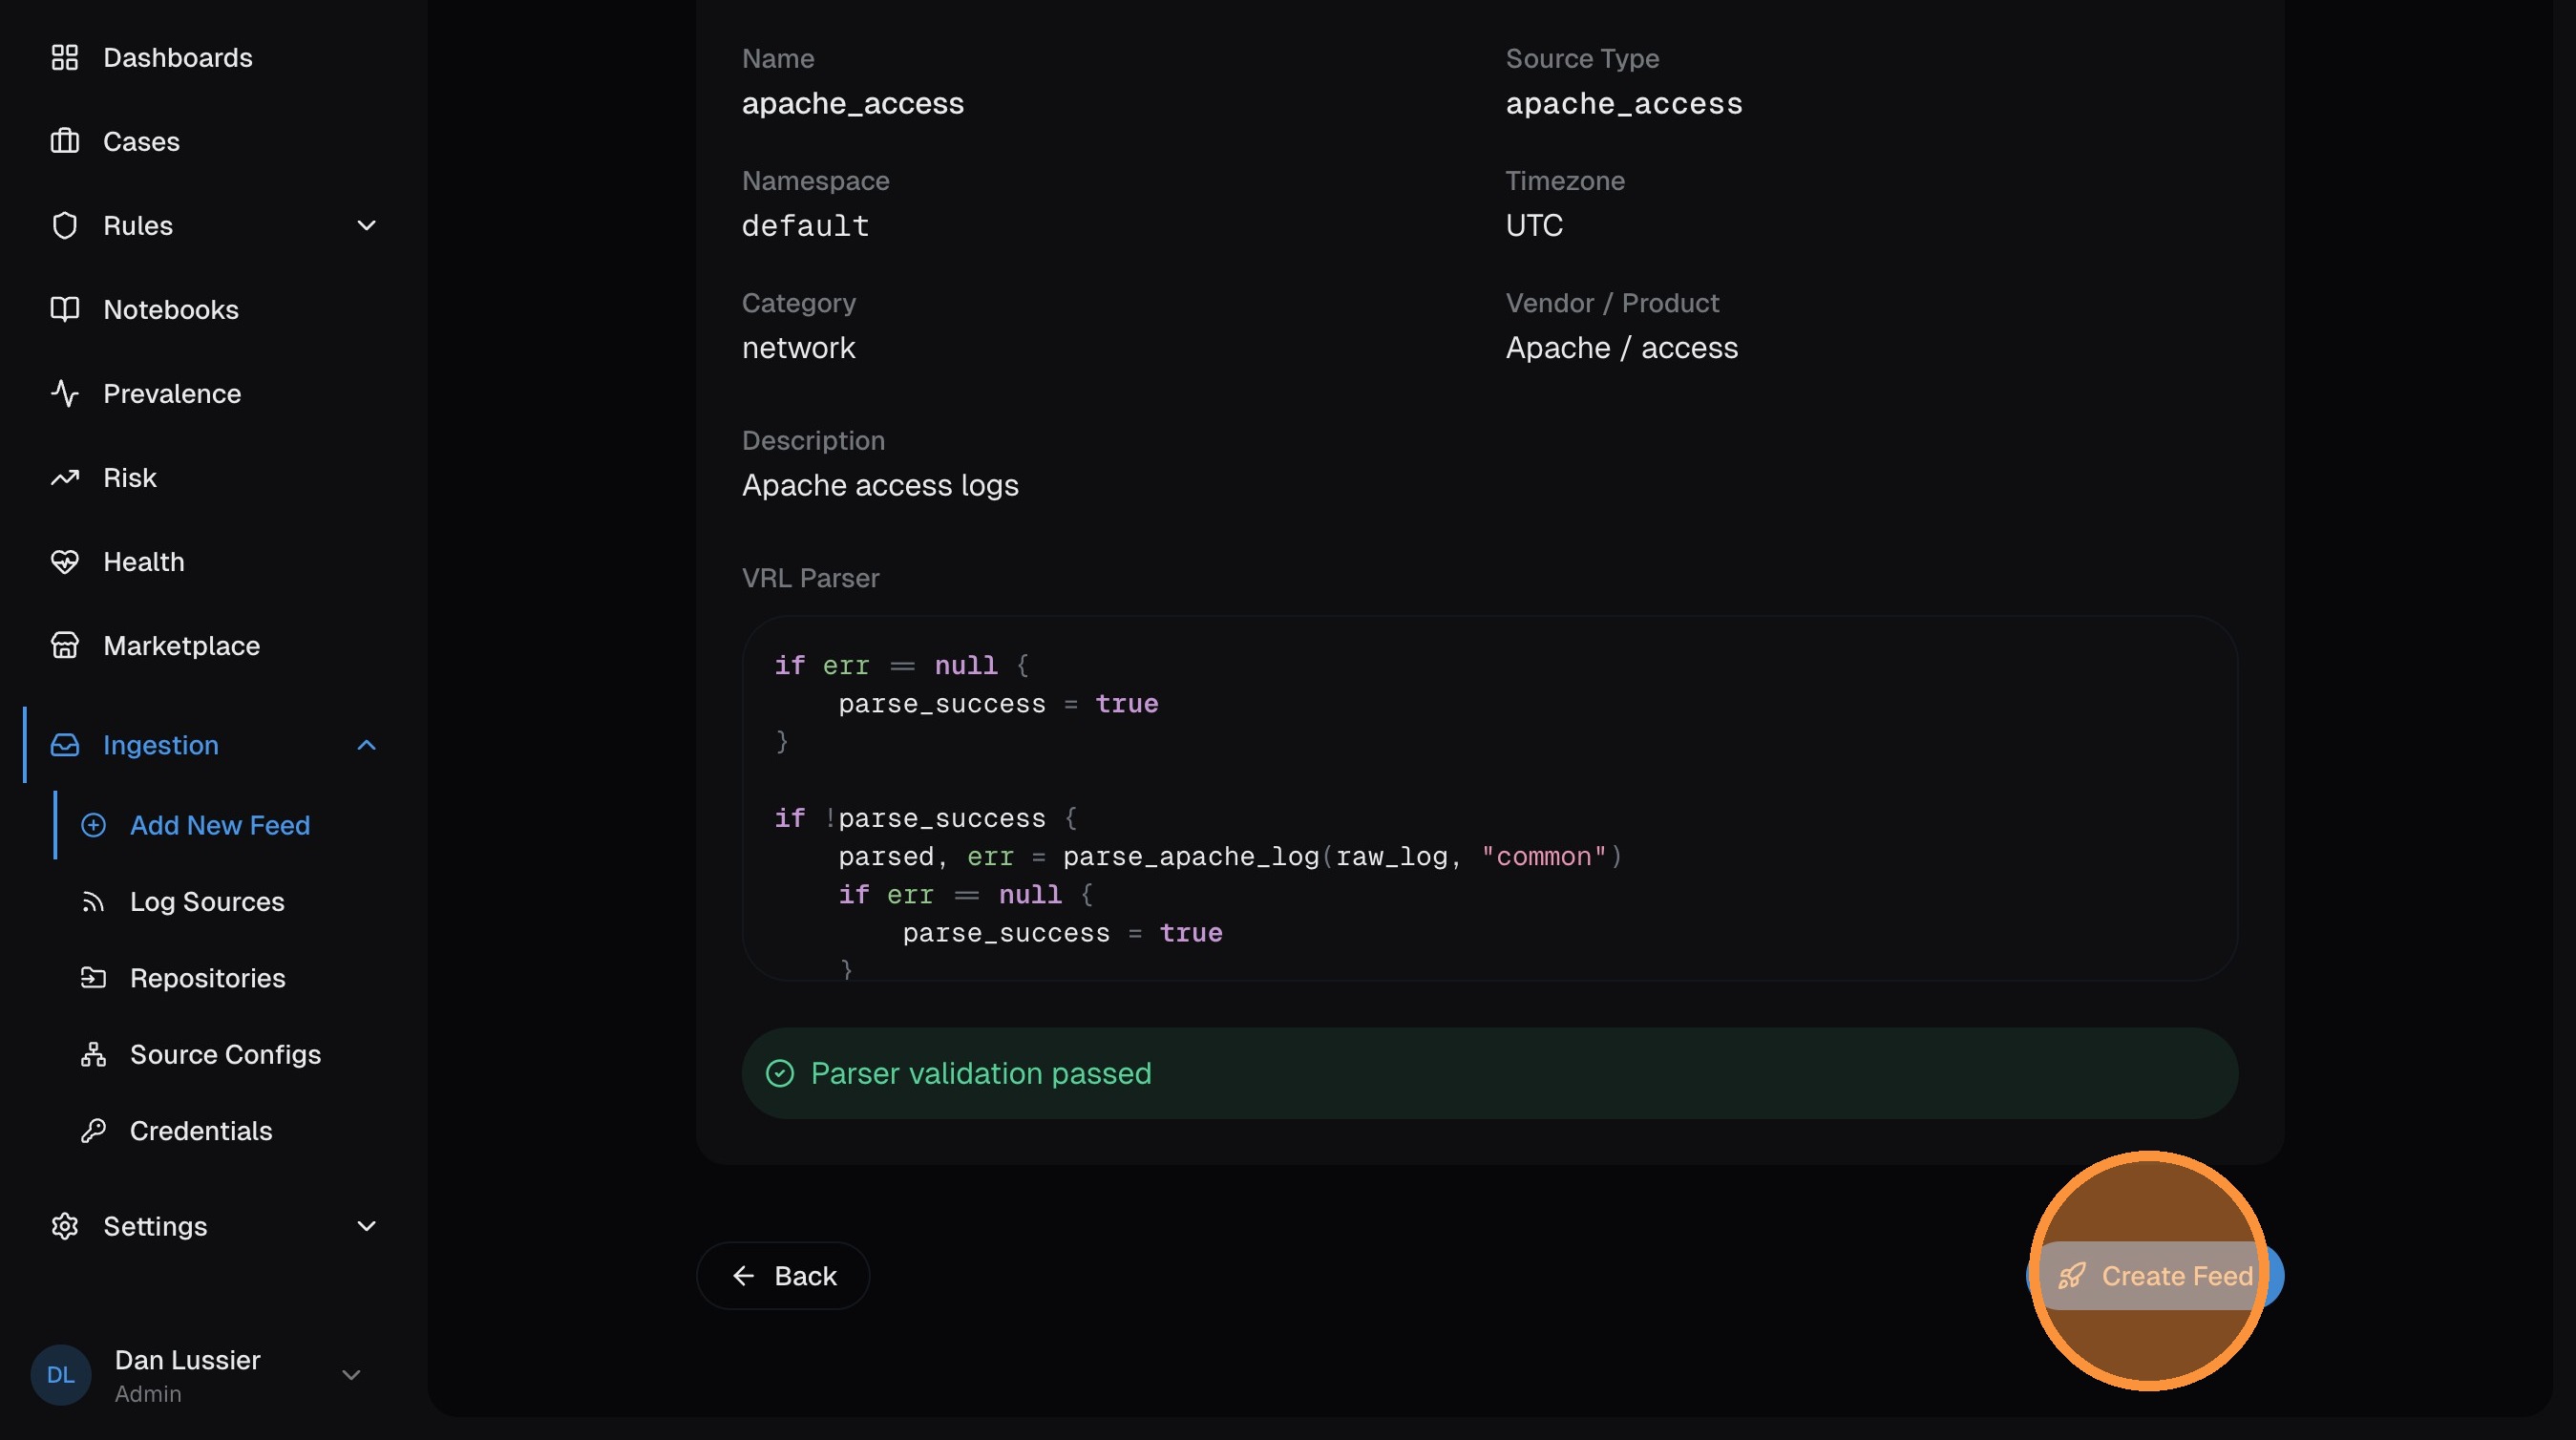
Review and create
The final page shows a summary of your feed configuration. Review everything, then click Create Feed.
Confirm in the dialog:
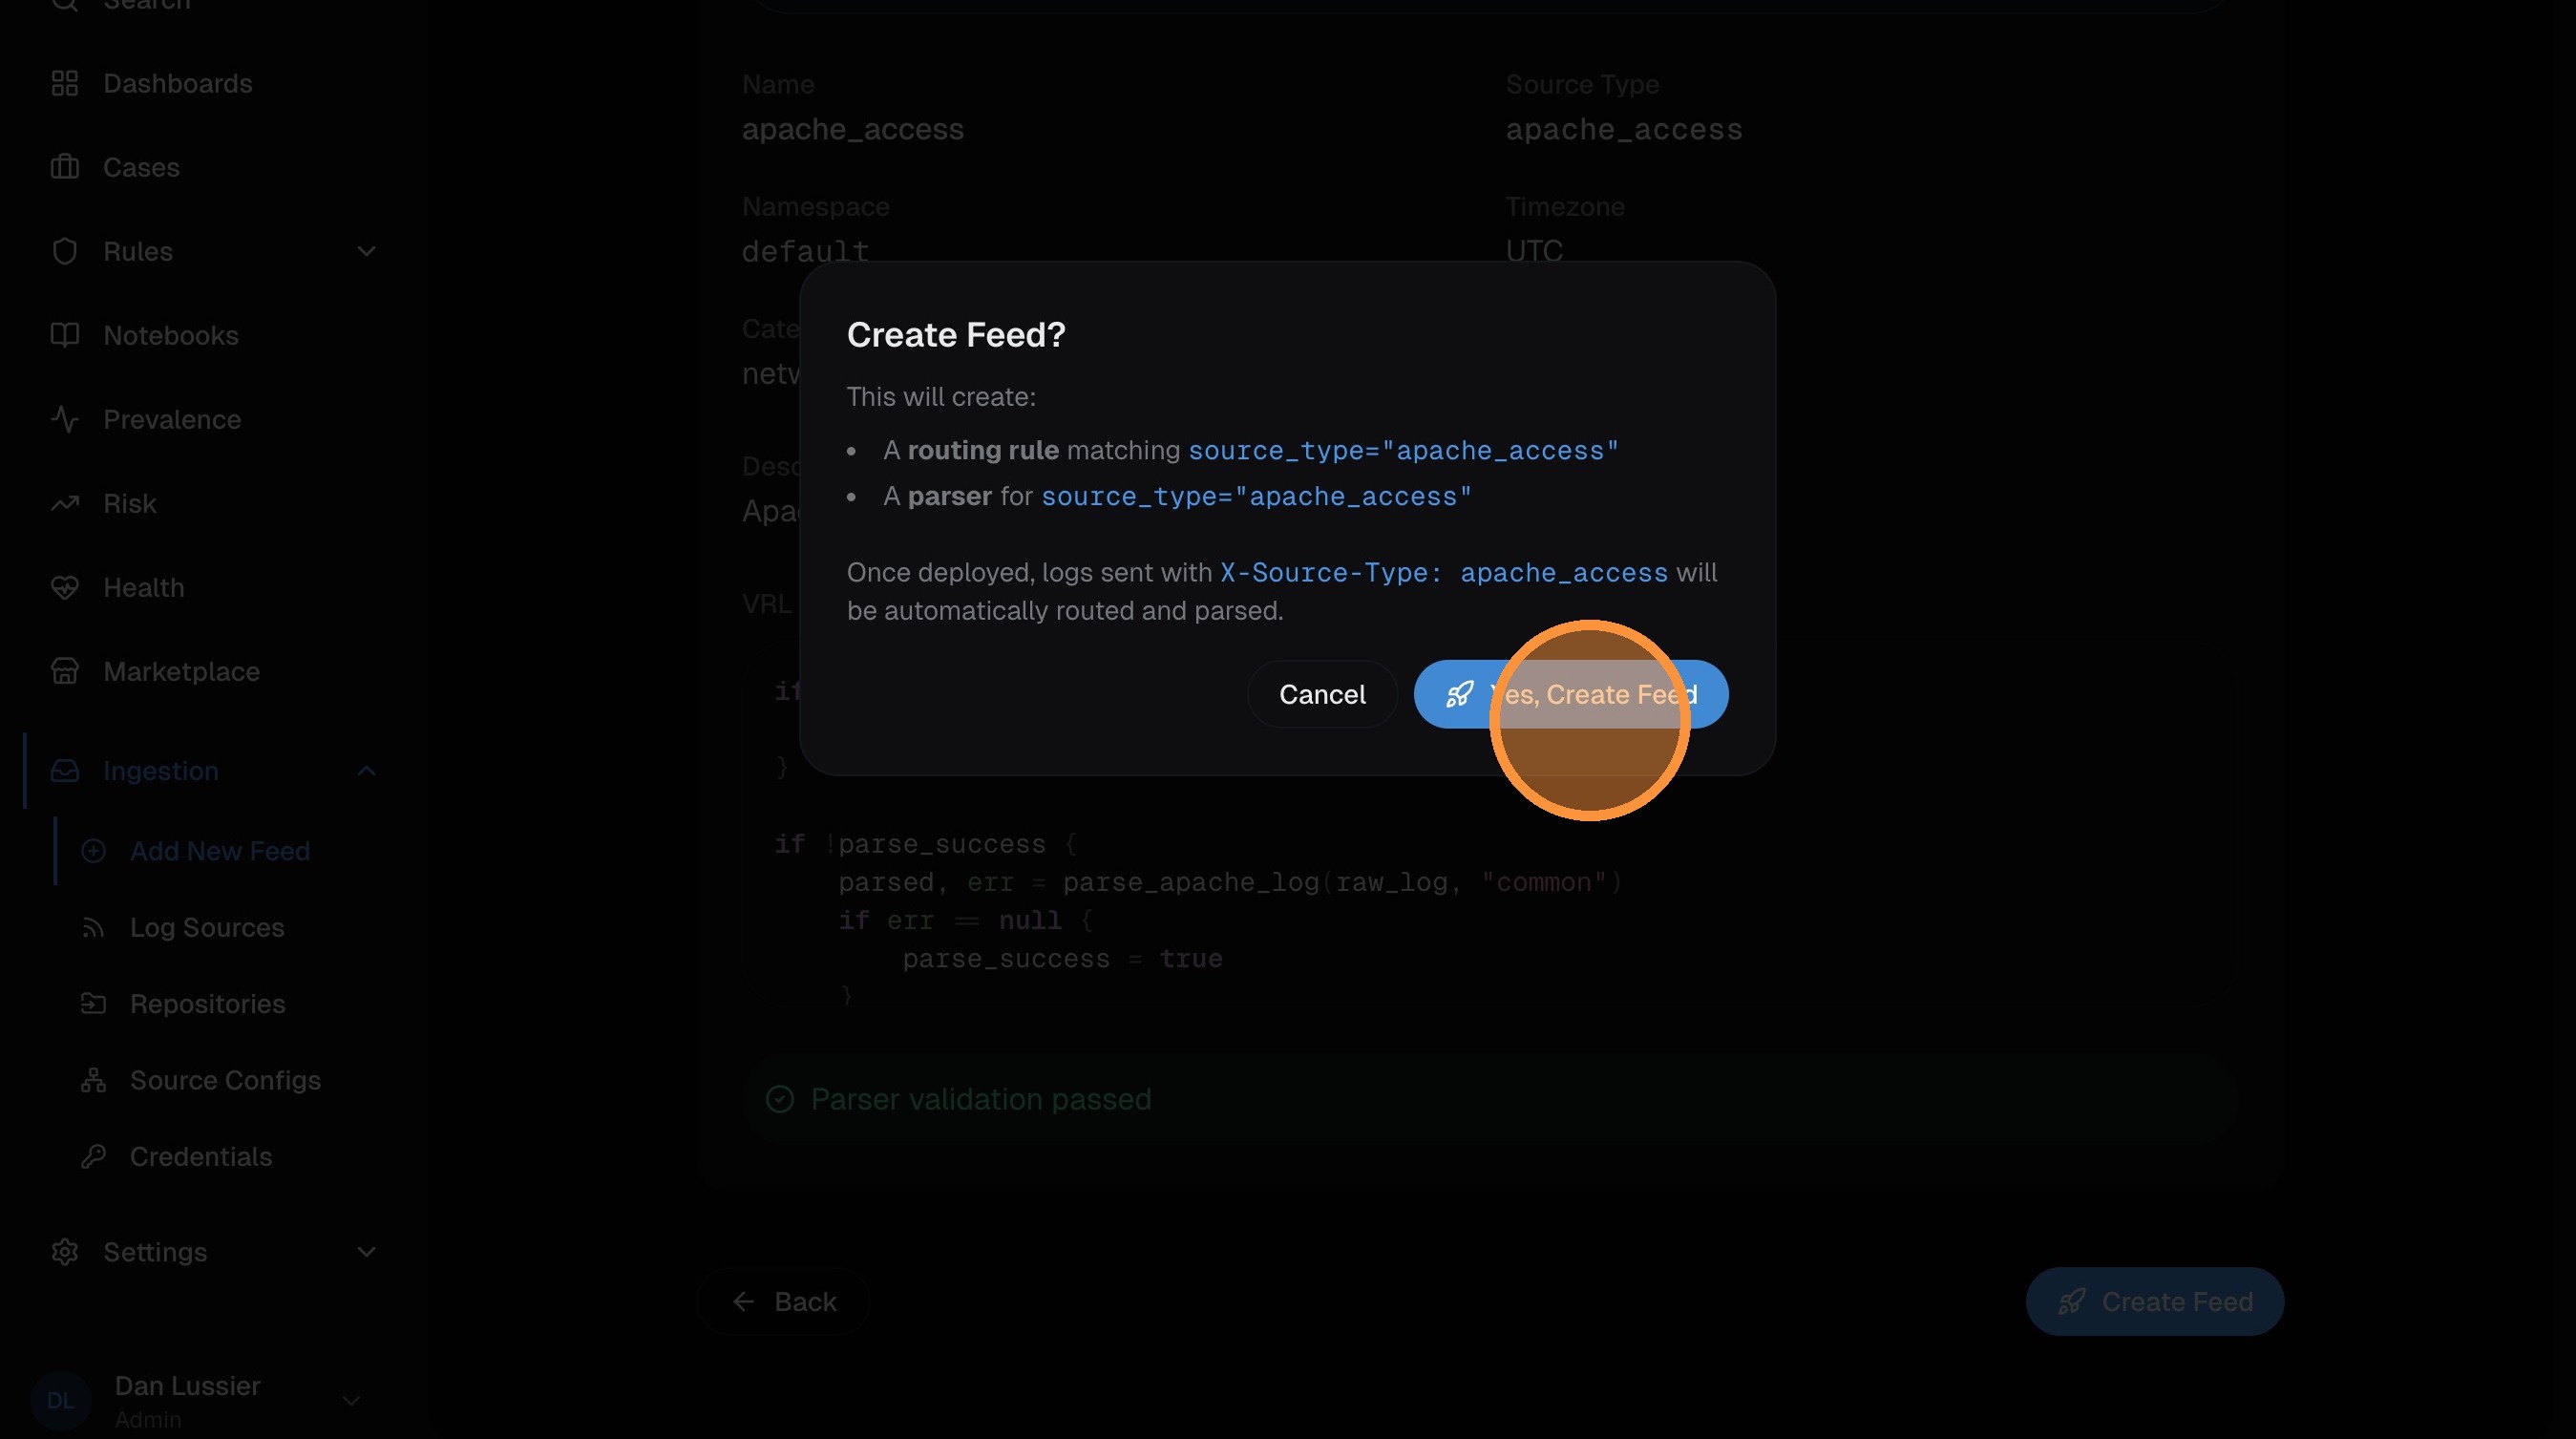
Your feed is created. Navigate to the log source detail page and click Publish to deploy it to Vector (same as Step 5 above).
Common First Feeds
Not sure where to start? Here are recommendations by environment:
Cloud
- AWS CloudTrail — import from repo, configure S3/SQS ingestion
- Okta — import from repo, send via HTTP webhook
- Azure Activity Log — import from repo, configure via Event Hub or HTTP
On-premise
- Windows Event Log — import from repo, set up on-premise collection
- Sysmon — import from repo (same Vector agent collects both)
- Firewall logs — import from repo, send syslog to Vector aggregator
General advice
- Start with your highest-volume source — more data means better tuning
- Add identity sources (Okta, Azure AD) early — detection rules reference them heavily
- Layer in endpoint sources (EDR, Sysmon) for process-level visibility
Next Steps
- Search your data — learn nPL to hunt through your logs
- Create detection rules — automate threat detection
- Configure enrichment — add GeoIP and threat intel
- Set up alerts — get notified when rules fire